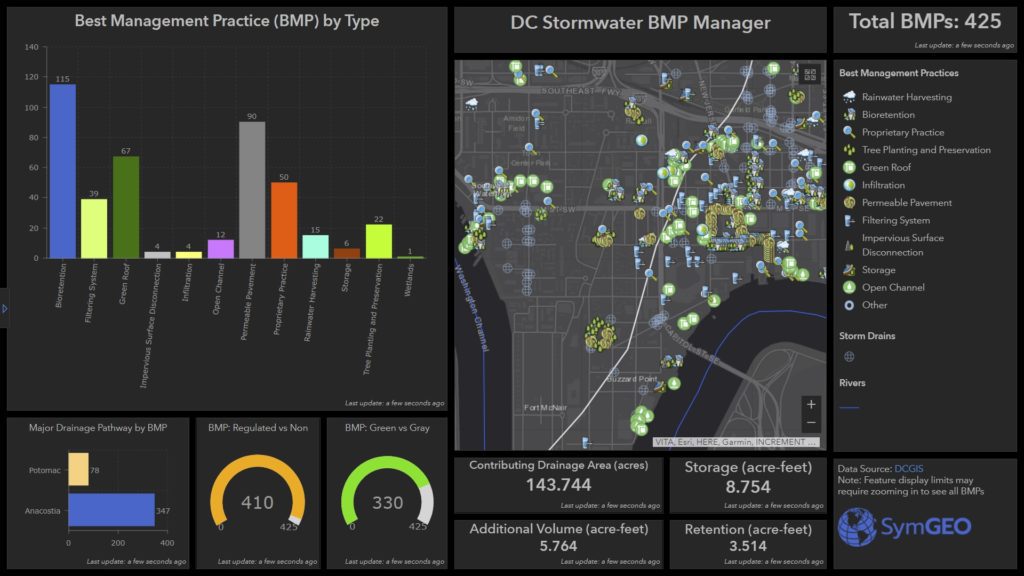
Manage Your Workforce

Do you have a mobile workforce in charge of inspecting, maintaining or interacting with assets? Watering trees, inspecting signs, putting up flyers, or targeted fundraising activities? If so, there is a new technology from Esri called Workforce that has your name all over it.

Beginning with asset data hosted in ArcGIS Online, a series of filters and queries can be used to determine which assets need to be assigned to your workforce. These might be assets over a certain age due for inspection, or locations where an issue has been reported. Assignments are made to named individuals in your ArcGIS organization, and contain information including location, priority level and due dates.
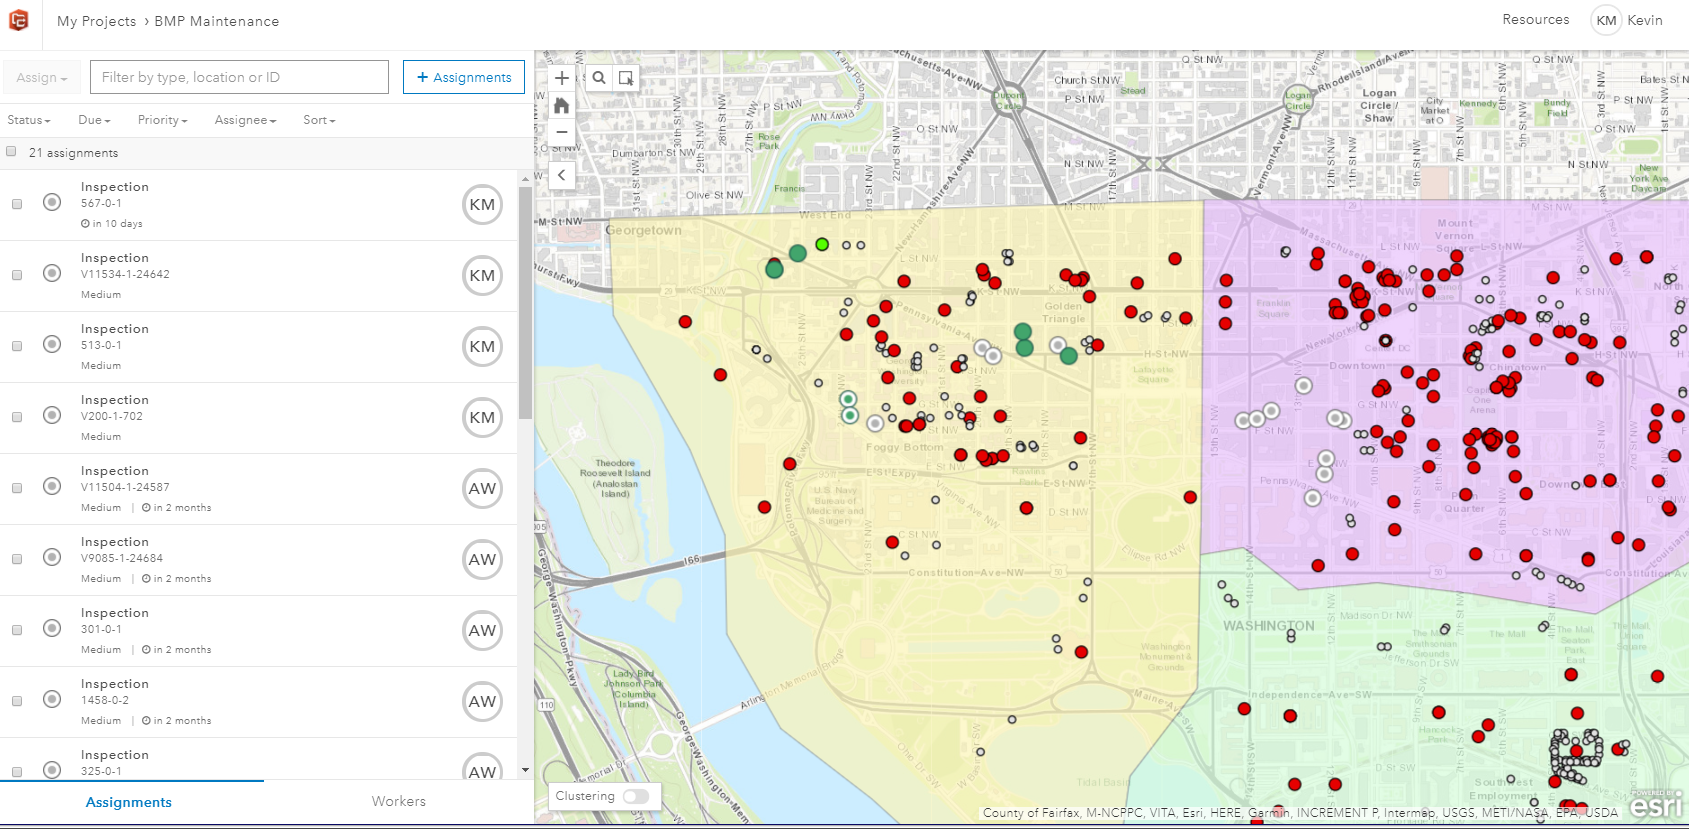
workforce project

The assignments are then pushed to the mobile devices of your workforce, where they accept, navigate to, and complete the assignments. This may entail entering in notes, or taking pictures, and updating the assignment status. This information is sent back to the centralized cloud-based ArcGIS Online database in near real-time in a connected environment, or upon data synchronization if out of cell / wi-fi range.
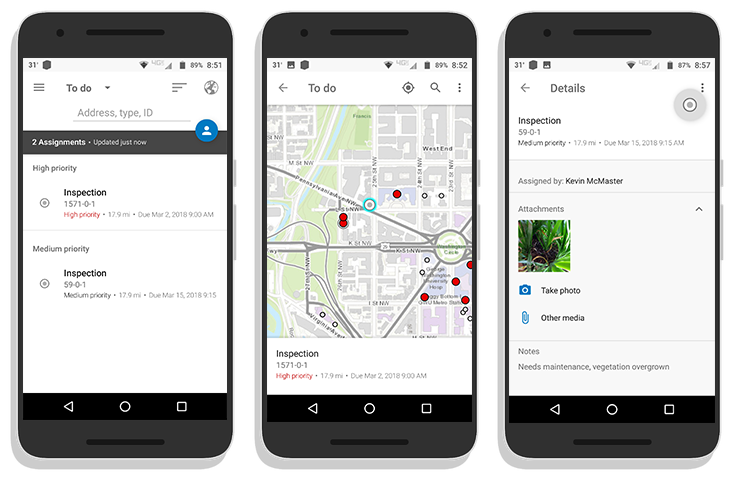
workforce phones

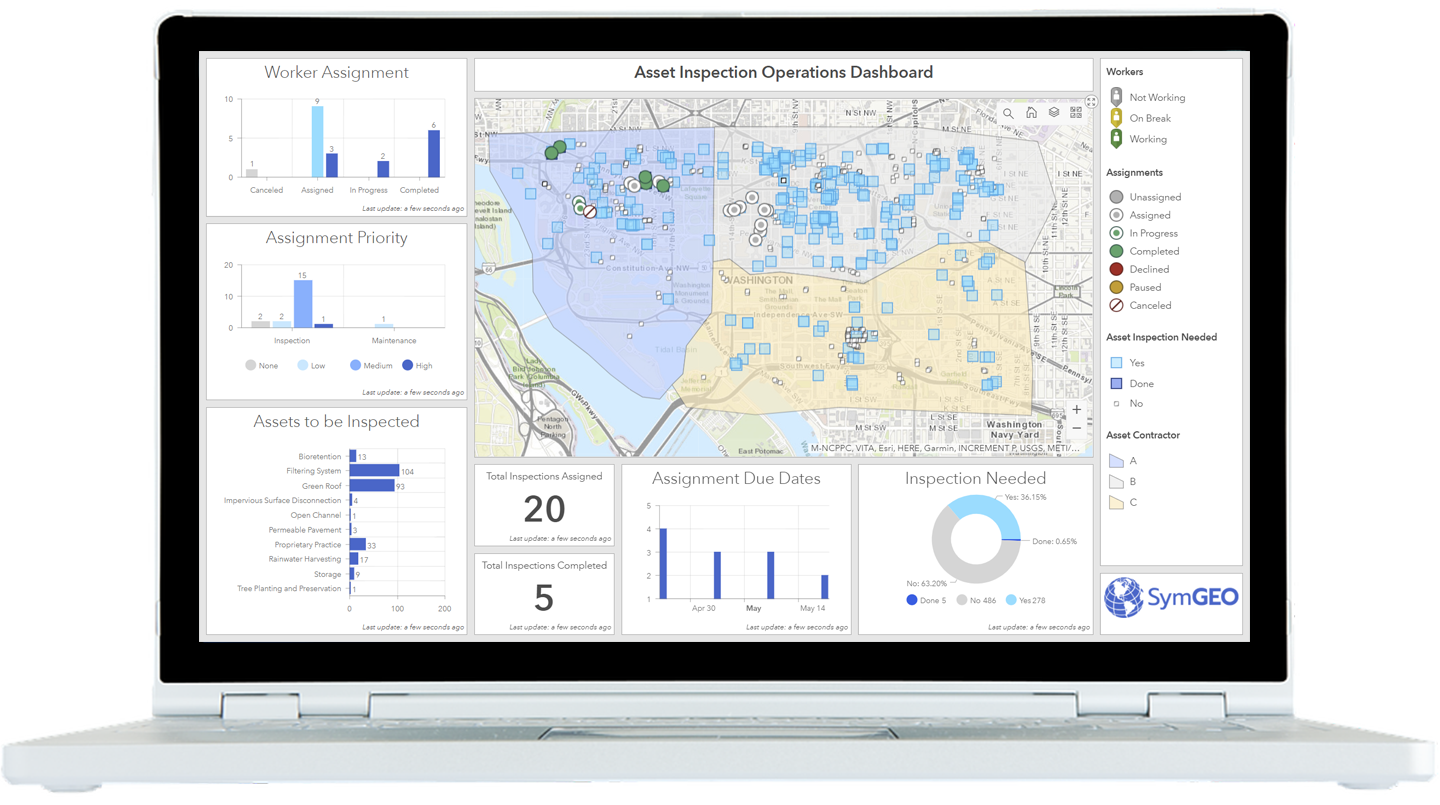
Back in the office, the workforce administrator can use the information to check worker progress, see current worker status and location, and re-allocate resources if needed. The information is easily aggregated and displayed using a dashboard or configurable web application.

If you’d like a hand getting set up, let us know, and SymGEO will put Workforce to work for you!
Building Imagery and Simulation

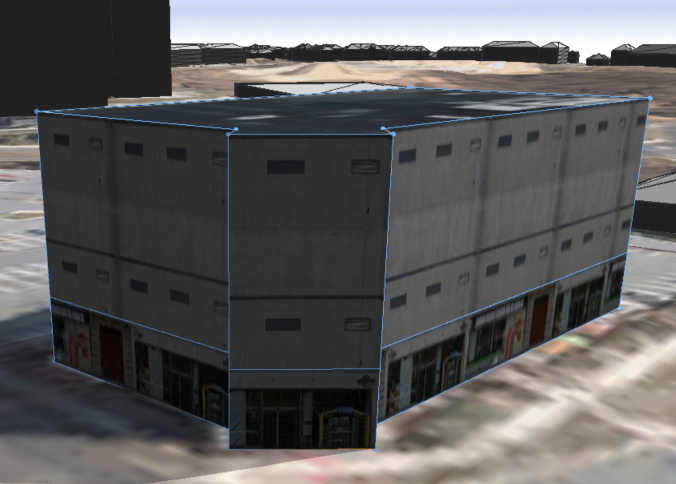
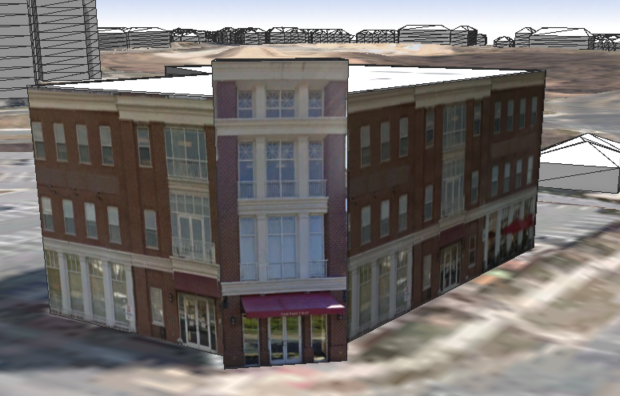
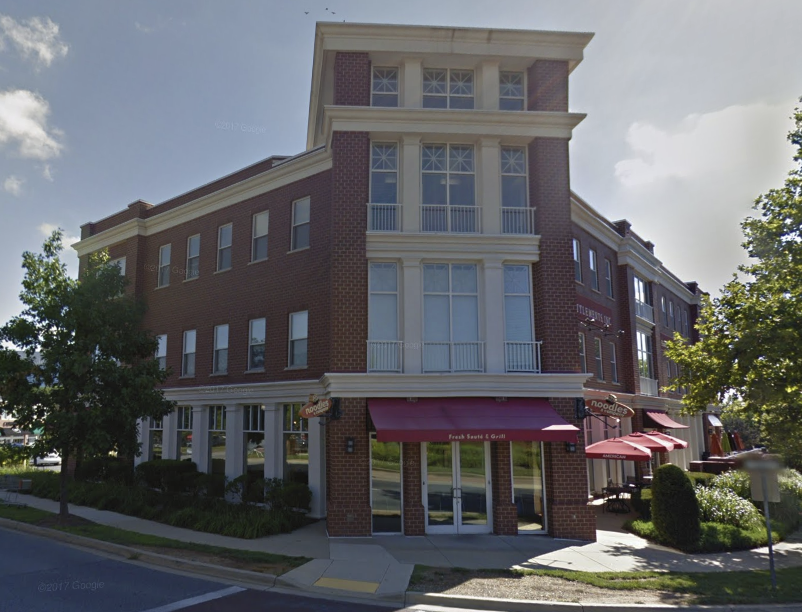
There are times when generic building models need to be upgraded to give a better representation of what is actually there. This may be useful for “hero” buildings that are immediately identifiable, or perhaps an area that has planned redevelopment activities taking place. Fortunately, adding custom texture in Esri’s CityEngine is a relatively straight-forward process. In the following example, a building is generated from LiDAR, slightly modified for a complex roof, and then ground photography is mapped as a texture onto the building. Before and after textures are shown below, with the actual building shown in Google Streetview for comparison.

generic building

textured building

google streetview

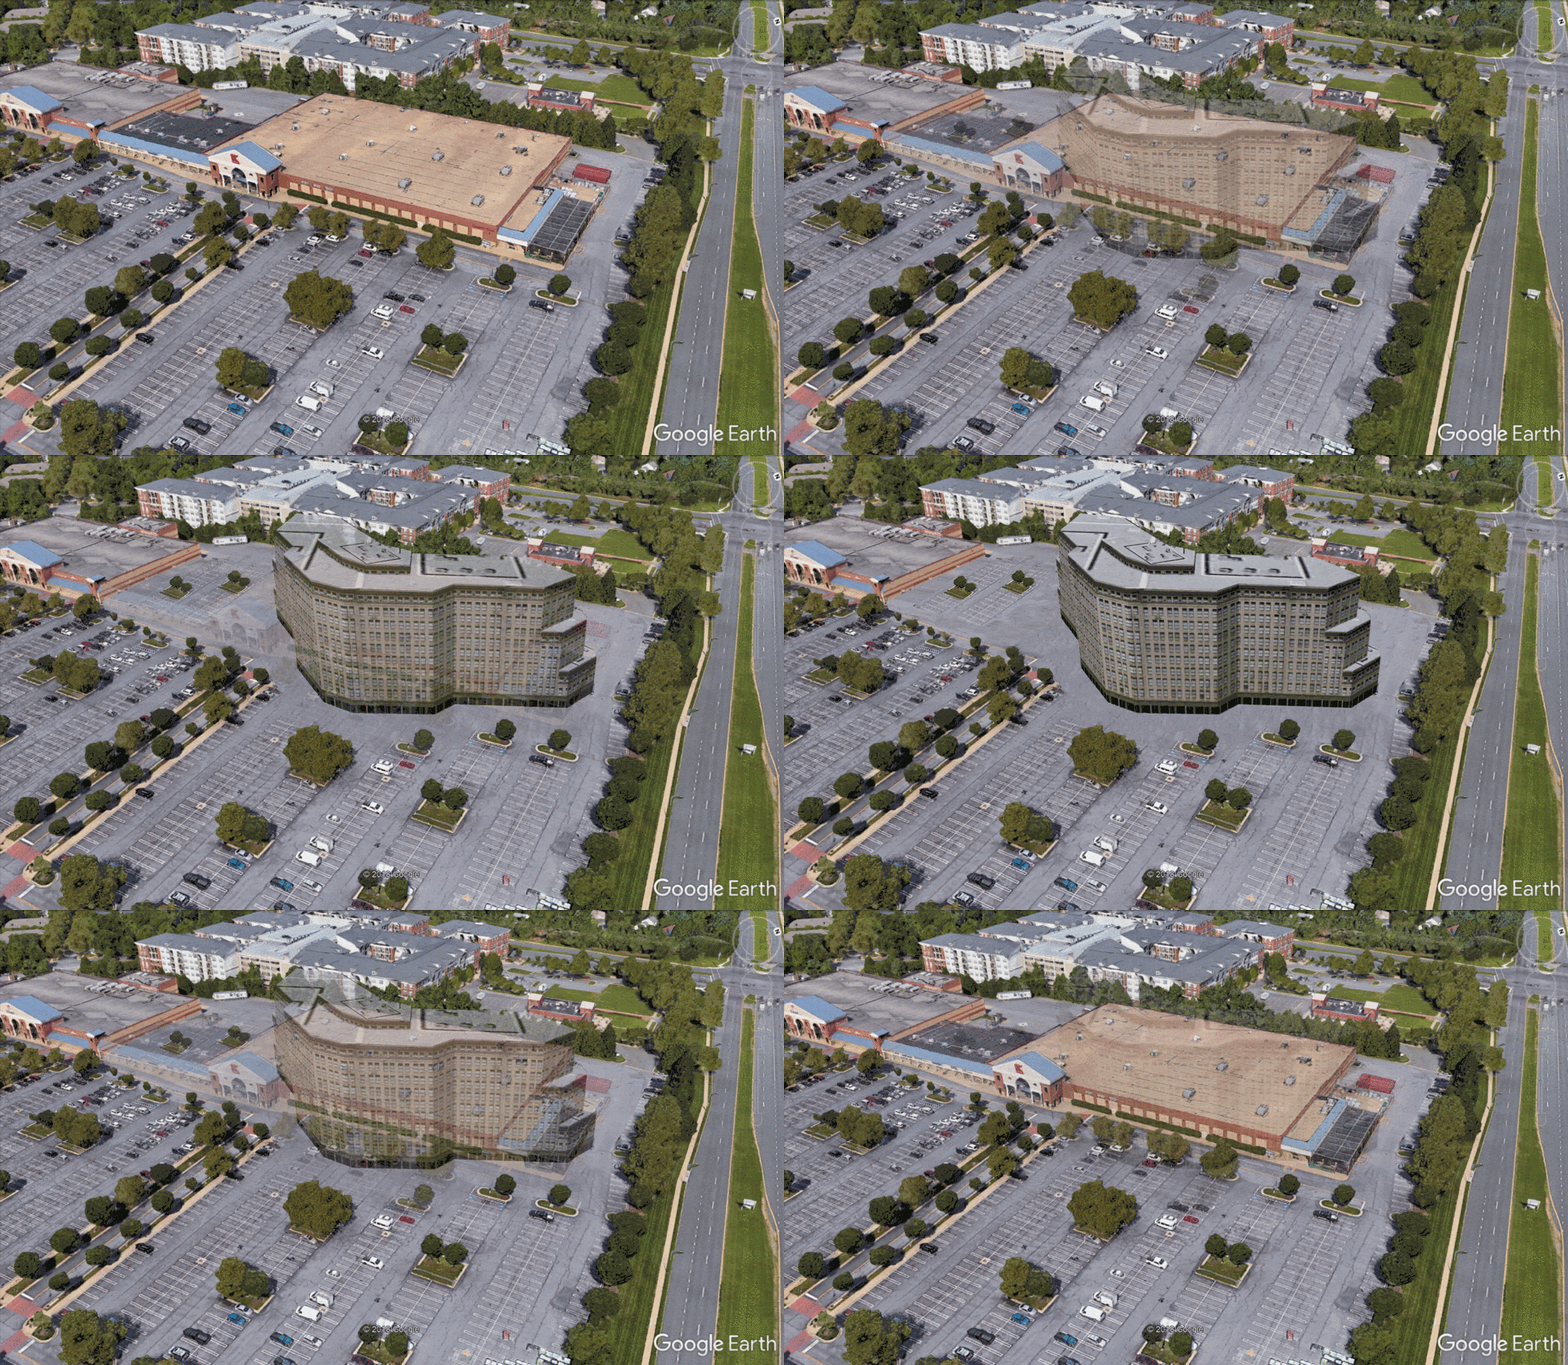
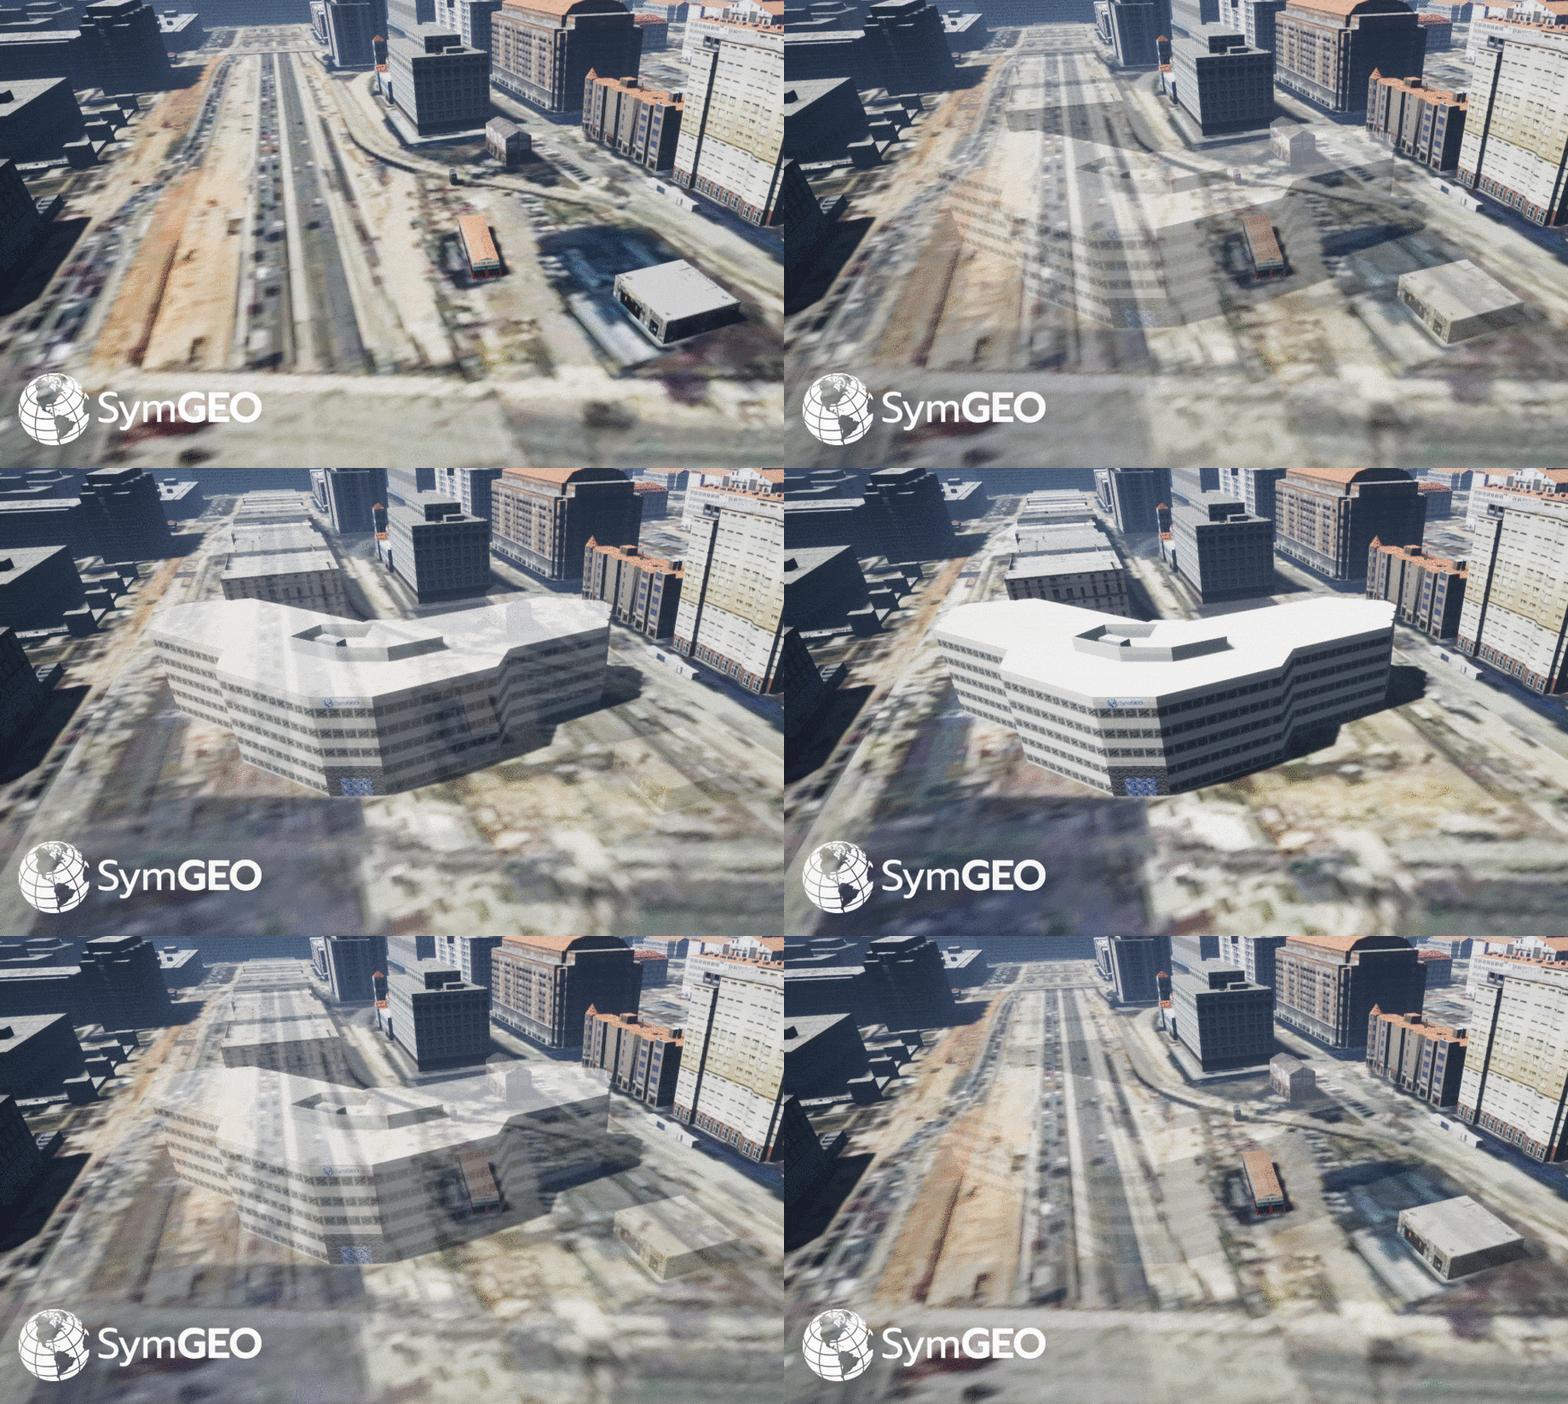
Another method of adding realism to a presentation is to use the Google Earth platform to capitalize on all of Google’s ground-based LiDAR information and photo mapping (where available). When combined with new building models and a little Photoshop, compelling before-and-after scenarios can be explored in a very cost-effective manner. This example shows where a Kmart complex may be replaced by a high-density residential building.

before-and-after simulation

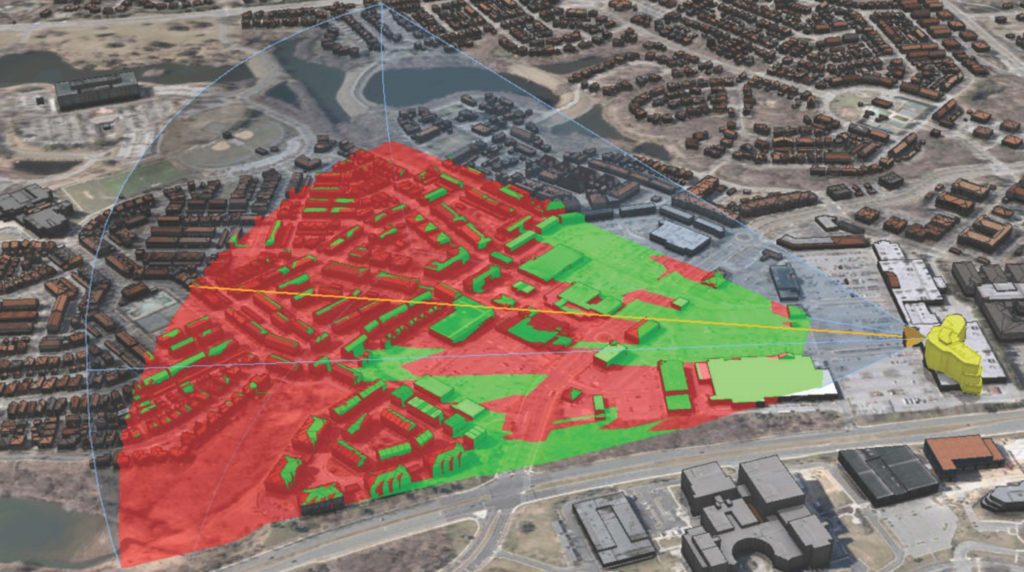
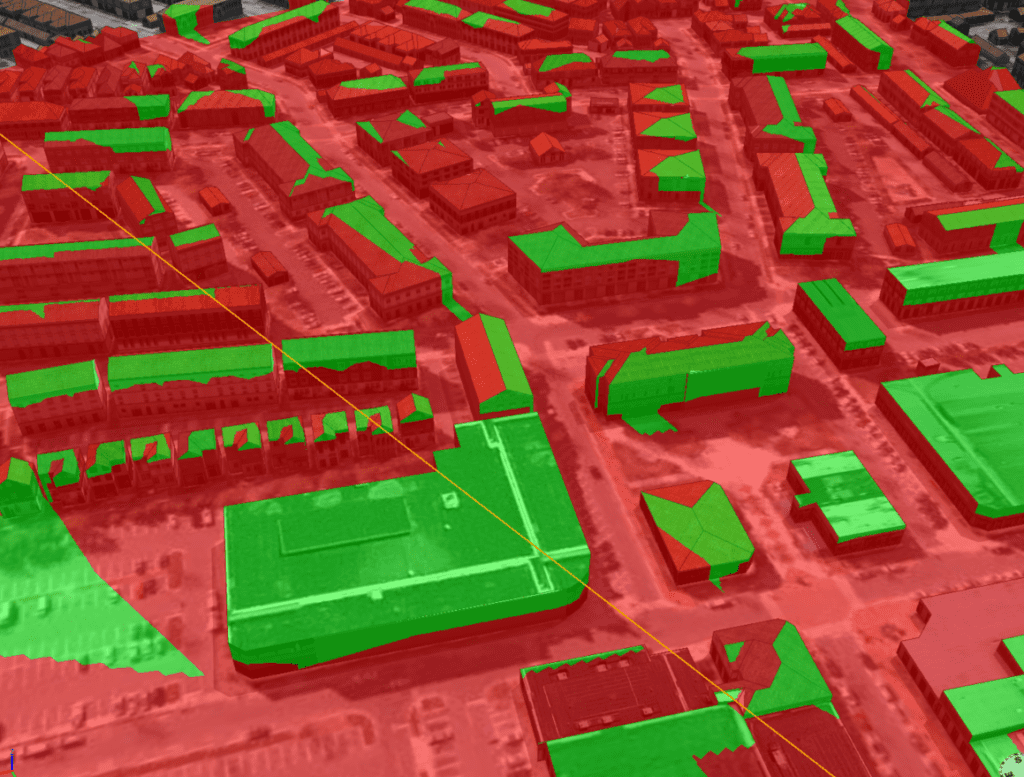
Viewsheds and site-lines can also be calculated in GIS, as all building models are constructed from either highly accurate geolocated LiDAR information or detailed architectural specifications. This helps pinpoint which existing structures may have their views impacted (shown in green), and so may required additional targeted public outreach before construction begins.

impacted views

Are you planning a new development, want to explore digital 3D data, or need to have your own virtual world built? Let us know, SymGEO is here to help!

Building a Digital City

I was recently asked by a friend in the commercial real estate industry if SymGEO could build a digital representation of Dallas. At the time I was pretty sure we could, based on available data, technology, and 3D modelling experience. However, as we all know in this fast-moving tech-focused industry, being “pretty sure” is a dangerous position, so today was the day to find out.

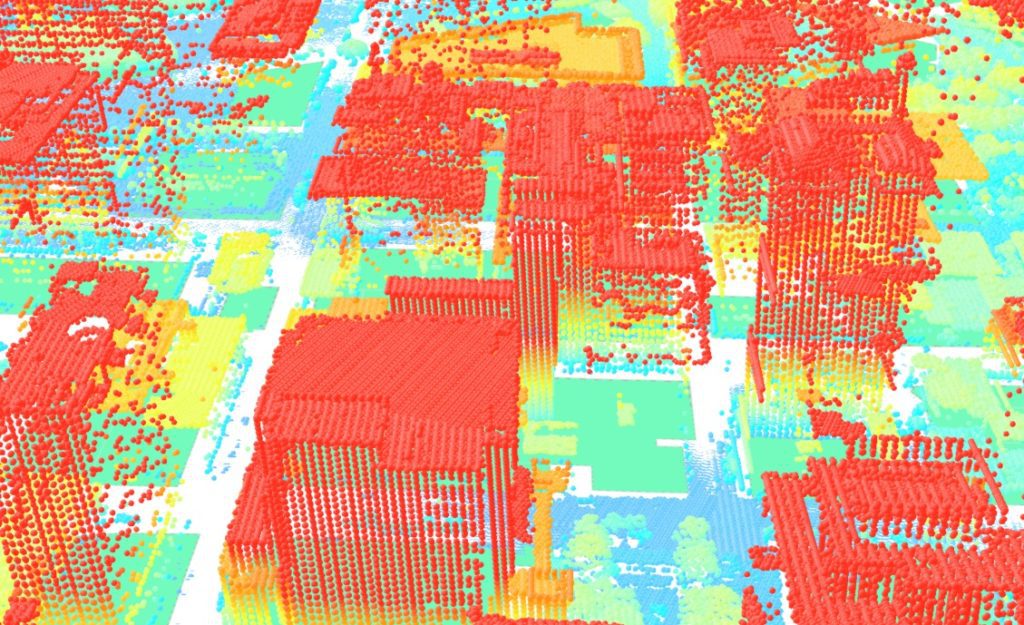
Our journey started with finding building footprints, which the City of Dallas has made available for download based on 2009 aerial photography. Fortunately, wide-area LiDAR with approximately 1 meter spacing was also collected at the same time and made available through TNRIS. This high-density survey method gave a blanket of point elevations, which are then used to derive digital terrain models (ground), and digital surface models (buildings and trees). When combined with building footprints, these are the best ingredients for a 3D city model.

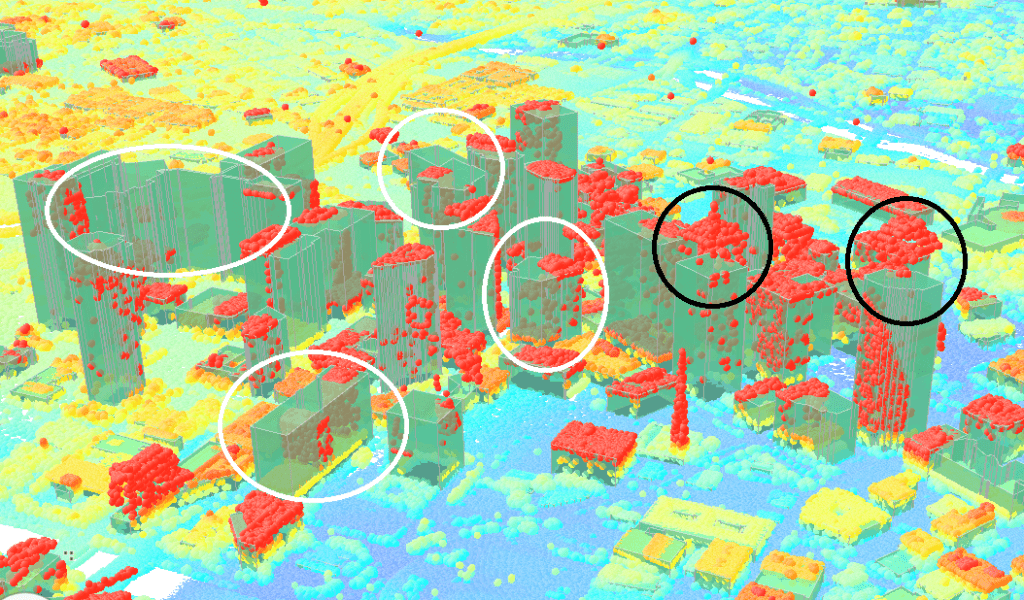
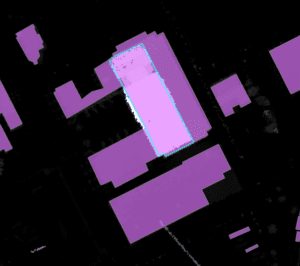
The next step was to run a series of scripts and tasks within ArcGIS Pro to determine the average height of each building and whether the roofs were sloped or flat. This gave great preliminary results, but due to the complex roofs in the downtown area, some generalization errors were introduced into the model, as each footprint could only have a single height associated with it. These errors can be quickly spotted by buildings that either have LiDAR points above the building envelope (circled in black), or a building envelope above the LiDAR points (circled in white).

Fortunately, due to the relative ease of spotting errors, the building footprints could be quickly modified to break them up based on the roof components to give multiple heights per footprint.

Interestingly enough, several footprint displacement errors were also discovered in the city-provided data during this process, so those were fixed at the same time. After several hours of fixing and segmenting footprints, the scripts were run again to re-calculate the buildings. Needless to say, it was easy and gratifying to see the rapid improvements in the model.

Finally, we brought the model into Esri’s CityEngine to give it a little color. When the digital dust settled, a fine looking model of Dallas emerged. See below, with a similar view of downtown Dallas from Google shown for comparative purposes.

Are you interested in having a digital city built, or would like to find out what else can be done with 3D modeling?

Let us know, as we’re here to help, and “Yes, we can build a digital city.”

March News 2018

It’s been an amazing second month since launch, and we’re happily rolling out project examples of our services and pushing the boundaries of technology. We were also honored to be selected for Esri’s Emerging Business Partner program, and appreciate the faith Esri has in our abilities. Follow us on Twitter or LinkedIn to stay in the know, as it’s an exciting world out there!


We have developed a state-of-the-art 3D building visualization workflow, designed to bring existing or proposed buildings to life. Fully immersive exploration options are guaranteed to add the wow-factor to your presentations.

Read more


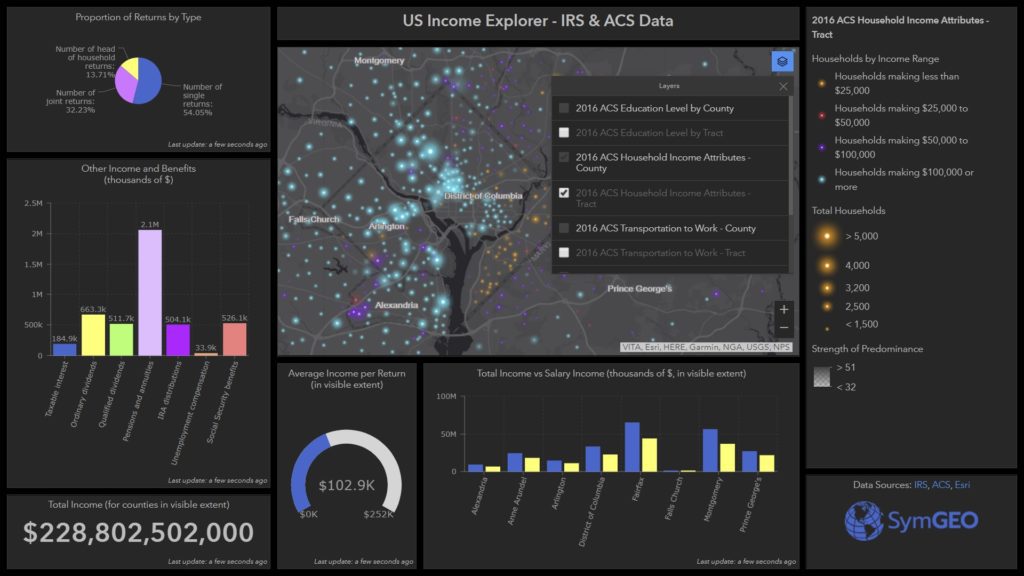
We pushed the boundaries of both cartography and dashboards with the US Income explorer, designed to show the sharp geographic divides in neighborhood area characteristics.

Read more


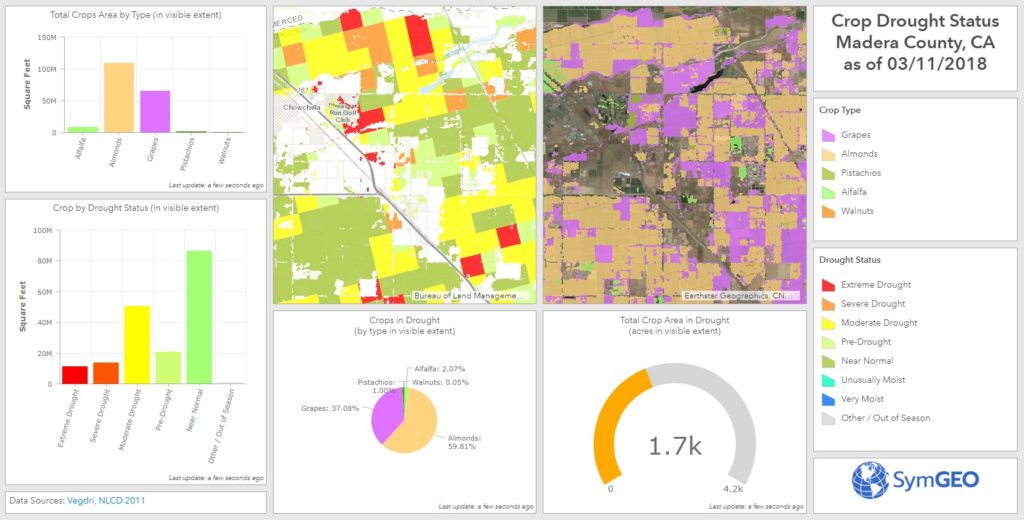
Drought in California impacts the $20+ billion dollar agricultural industry. We leveraged near-real time satellite-derived drought data to find out exactly which crops were at risk for an example county.

Read more


Efficient asset management is a snap when you bring the right data together with configurable application technology, as shown by our stormwater management work in Washington DC.

Read more