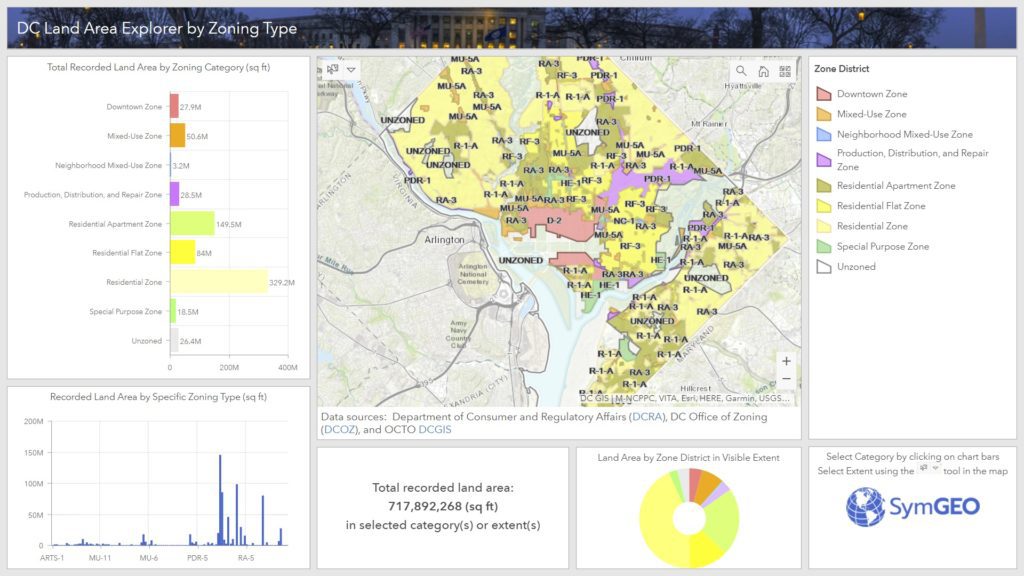
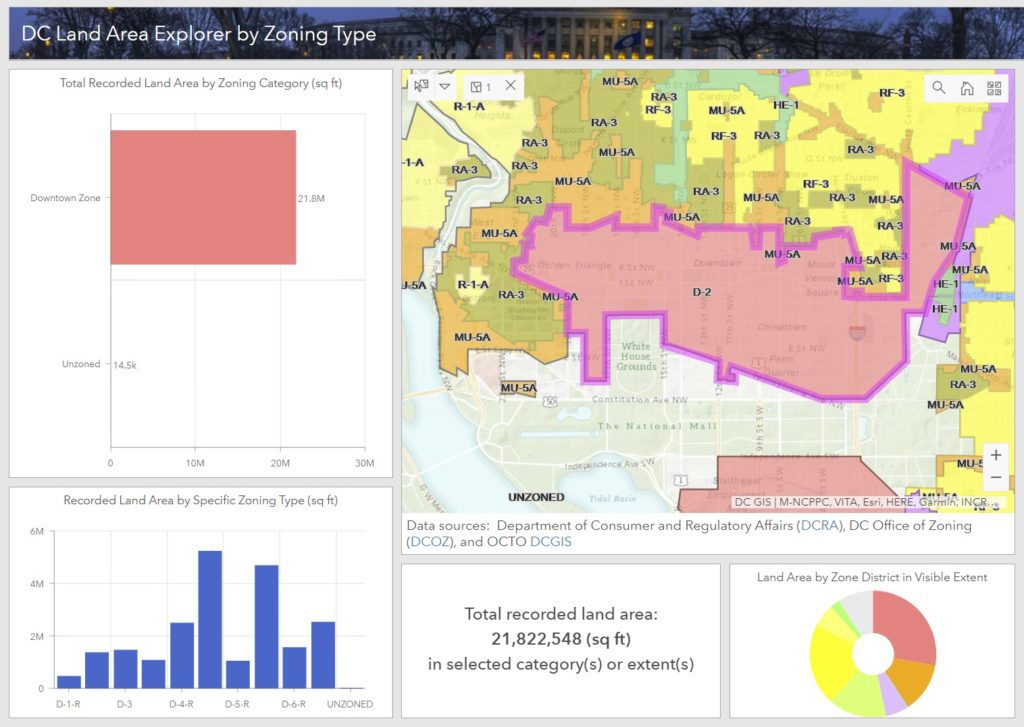
Ever wonder how much land area there is in DC by zoning district or specific zone? Well, wonder no more, as we sliced and diced the data, and created the DC Land Area Explorer by Zoning Type. This application leverages Esri‘s select by chart category functionality in ArcGIS dashboard. Data is kindly provided by our friends at DC Office of Zoning (DCOZ), the Department of Consumer and Regulatory Affairs (DCRA), and a fabulous basemap by OCTO’s DCGIS team.
Users can select zoning categories or specific zones by clicking on the bars in the charts. This will update the total recorded land area calculation to just the selected zone(s). Alternatively, for really detailed analysis, zooming into the map and using the “select” tool in the map window allows the selection by zoning district, specific zone, or even property boundaries.
Publishing, organizing, and making data accessible on the web can be tricky business in an ever-changing technical landscape. Not surprisingly, there isn’t a “one-size-fits-all” solution due to the number of infrastructure variables involved in setting up your own data server.
ArcGIS Enterprise, a relatively new product offering from Esri, is designed to help streamline the process and provide maximum flexibility on deployment scenarios. Enterprise is a full-featured mapping and analytics platform that includes a powerful GIS server, plus dedicated web-based GIS infrastructure to organize and share your work.
Enterprise includes:
An enterprise GIS portal for organizing and sharing GIS assets.
A data store for secure storage and fast access to maps and data.
Optional GIS capabilities for real-time imagery and large data processing.
Even more capabilities when you opt for GIS server extensions.
An enterprise geodatabase, the ultimate in geodata storage and management.
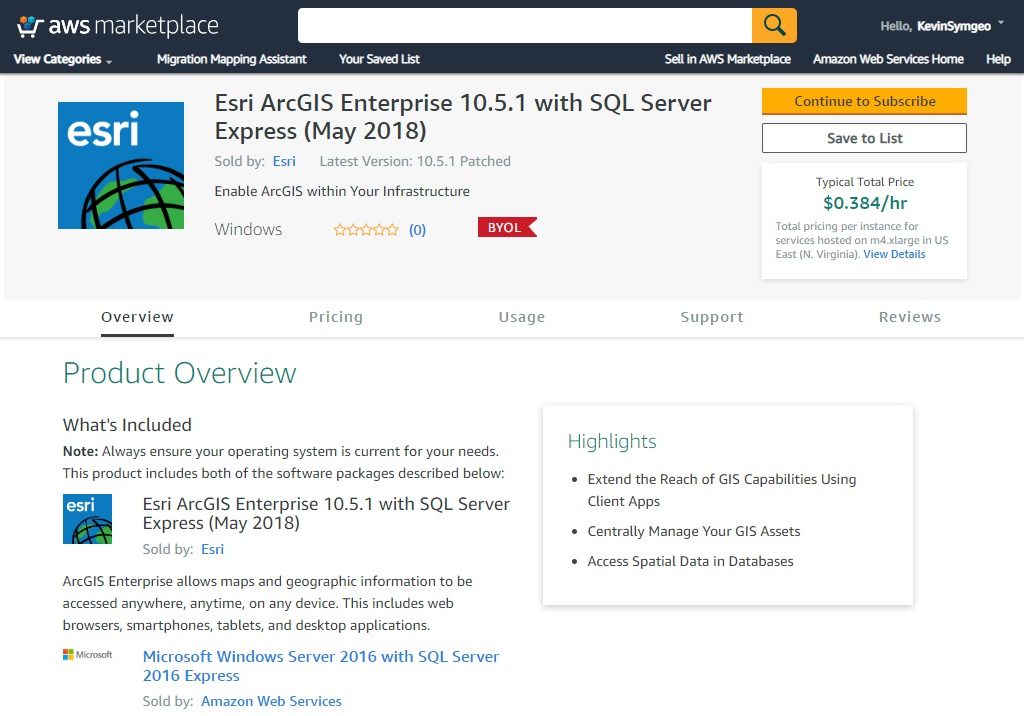
Esri offers a number of solution components that are ready to be implemented; both in the cloud through Amazon Web Service (AWS) or Microsoft Azure, or on premise using your own server.
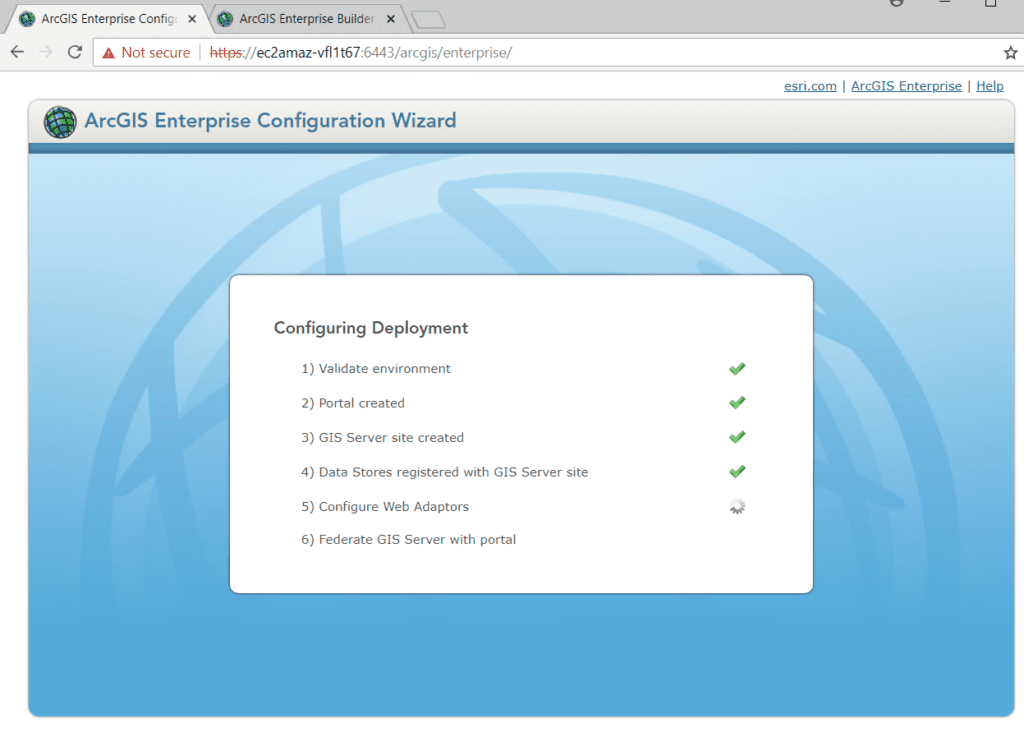
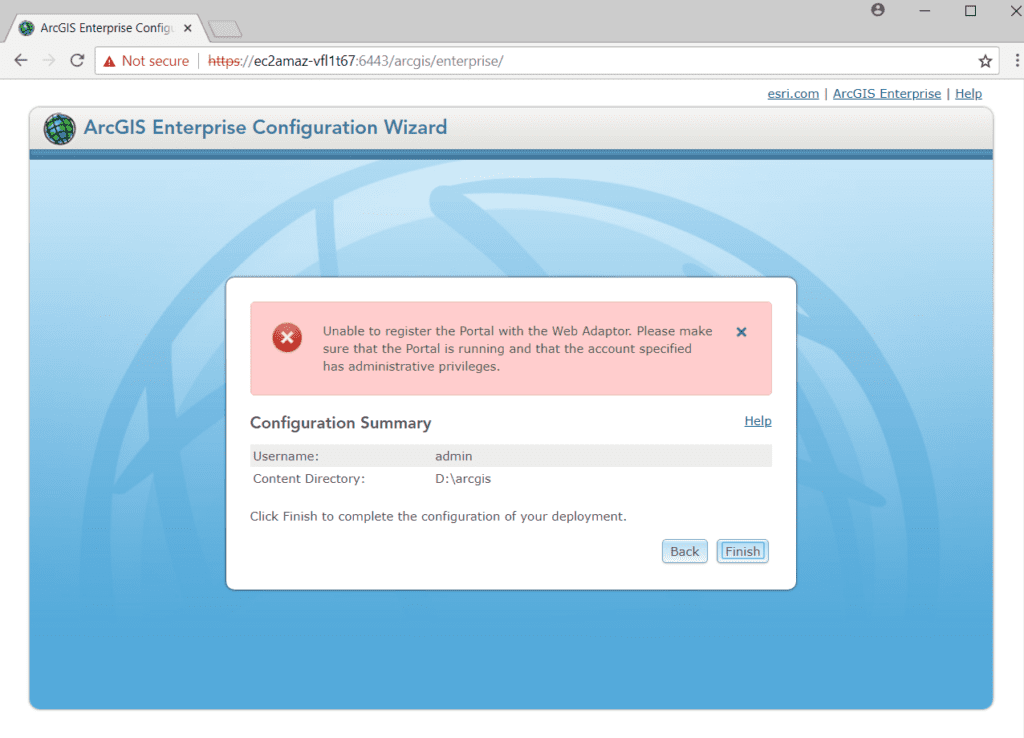
Based on our testing, the most easily accessible implementation is achieved using the Builder solution. However, even that implementation has a few tricky steps that involved manually configuring web adapters, setting bindings, web context URLs, and static public IP addresses.
Fortunately, when it does error out, the error messages are usually quite specific and pointed us in the right direction.
There is also a very active internet community ready to jump in and help on this topic. When all else fails, Esri tech support is the most patient, educational crew around based on our experience of several hours of configuration trouble-shooting.
Once Enterprise is successfully installed, user groups, permissions, logins and account set up is relatively easy. This allows each user the required level of access, and complete control over the branding and visibility of your data.
Keeping track of who is where, what’s coming soon, square footage available, and when leases are ending can be quite a challenge when hundreds (or thousands!) of properties are involved. Fortunately, GIS is perfectly suited to this task of commercial property management, as it combines space, time, attributes and symbology into one cohesive picture.
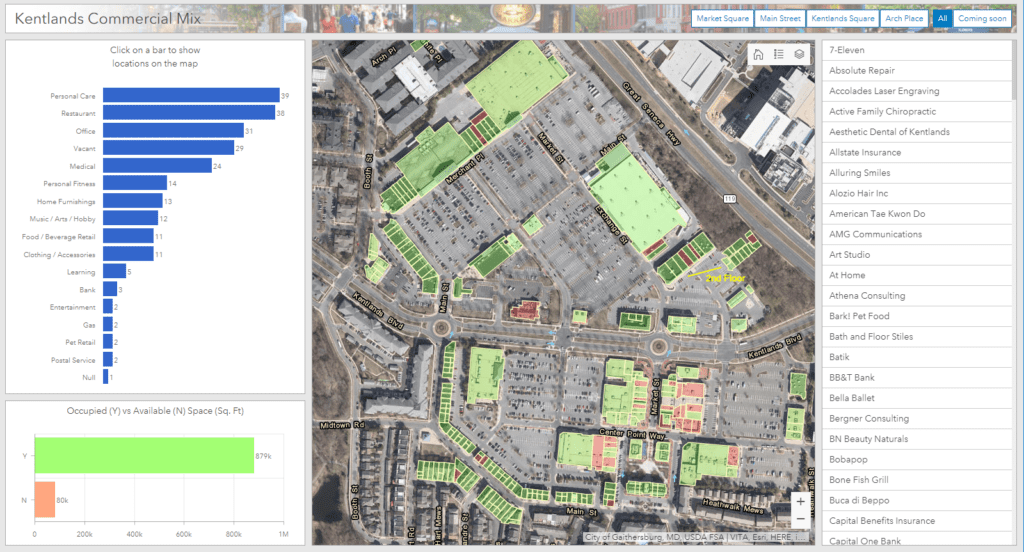
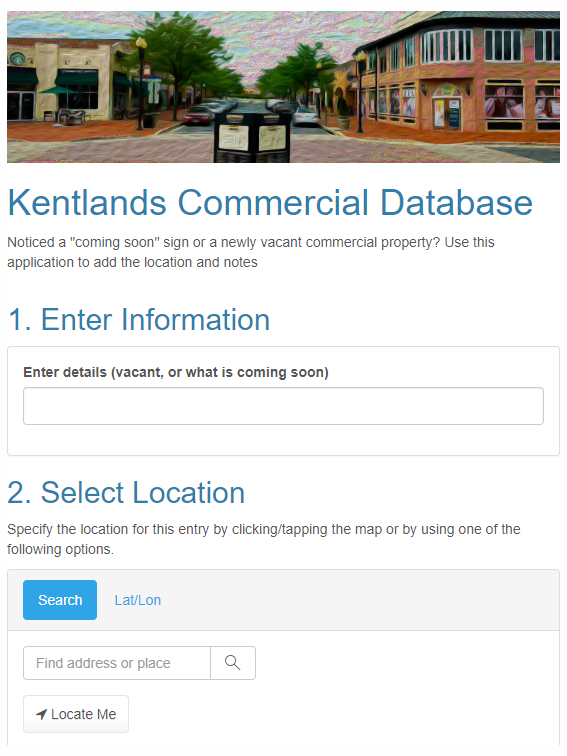
For the Kentlands community in Gaithersburg, MD, ArcGIS Online data was used to power an initiative called Downtown: Energize!, that has garnered critical acclaim from residents and business owners alike. This Hub site designed to explore existing retail, gather community ideas, and identify opportunities for commercial business. With almost a hundred commercial properties involved, including several large commercial parcels, the data came in the usual assortment of formats (pdf, GIS, field collection). However, the end result was a cohesive framework designed to be updated and informed by the community it serves through a crowd-sourced GeoForm application.
Searching by business name was enabled through a configurable application that is embedded into the Hub site. There is also active development and building reconfiguration occurring in this area, as shown below with the current buildings overlaid on last year’s imagery. This solution provides a one-stop shop for information about current commercial businesses in the area, and a common platform for the community to use.
If your community is ready to get started with a Downtown: Energize! initiative or your business would like to use GIS as a property management tool, let us know as SymGEO is here to help!
Time flies when you’re having fun! From sledding to traffic to wetlands, SymGEO was all over the map in July – read on for details.
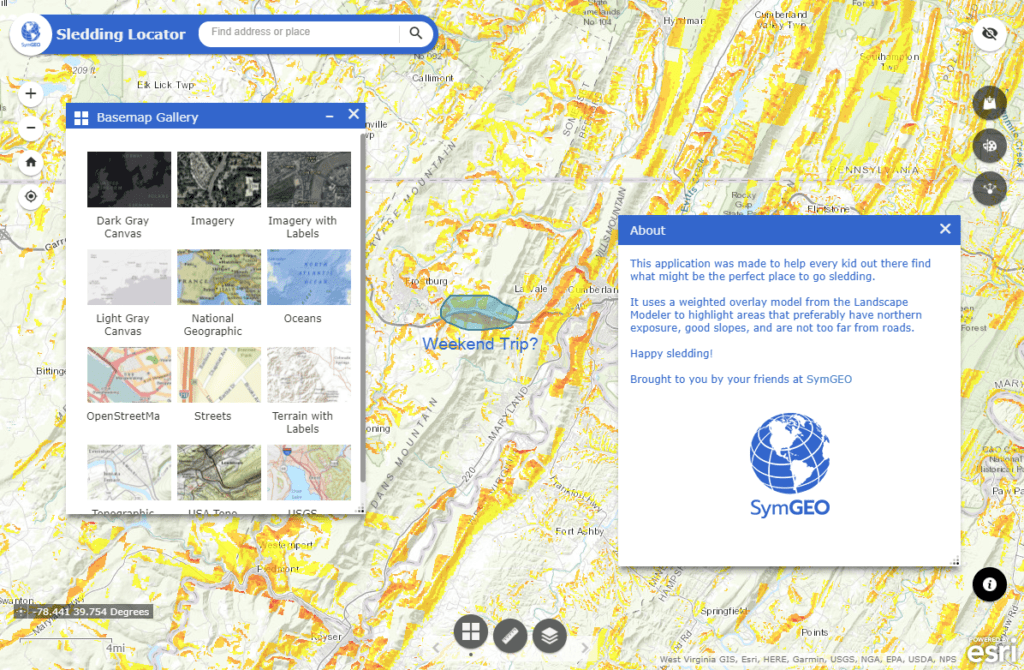
This month our thoughts turned to sledding (nobody knows why, and we’re not supposed to ask), resulting in a first-of-its-kind optimal sledding locator application. Harnessing the power of suitability modeling and Web AppBuilder, we are now ready for winter.
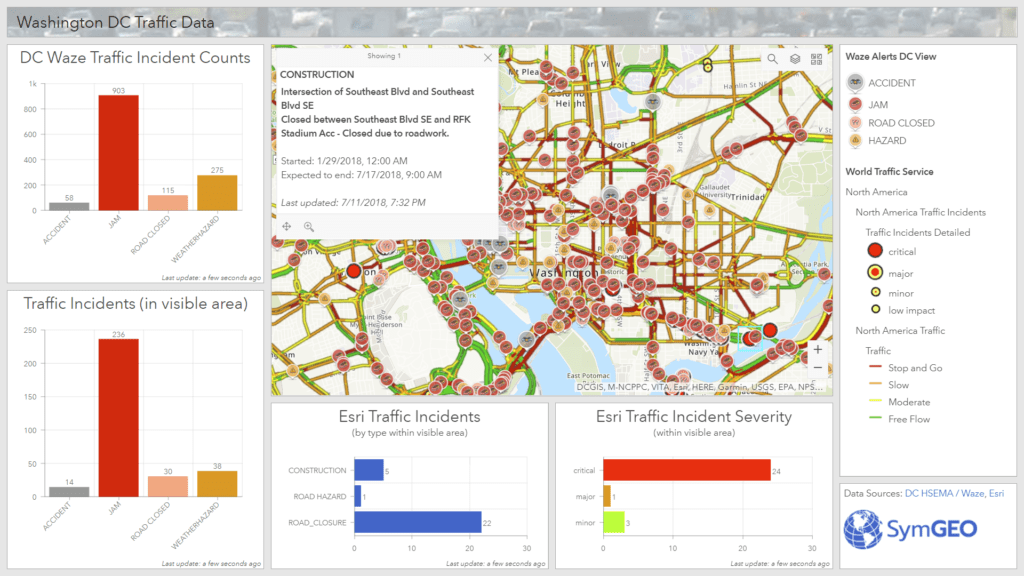
From there, we were excited by the new expanded partnership announced between Waze and Esri, so we immediately jumped on the bandwagon and built the DC Traffic Dashboard. Plan your route, ready the audio-books, and get to your happy place!
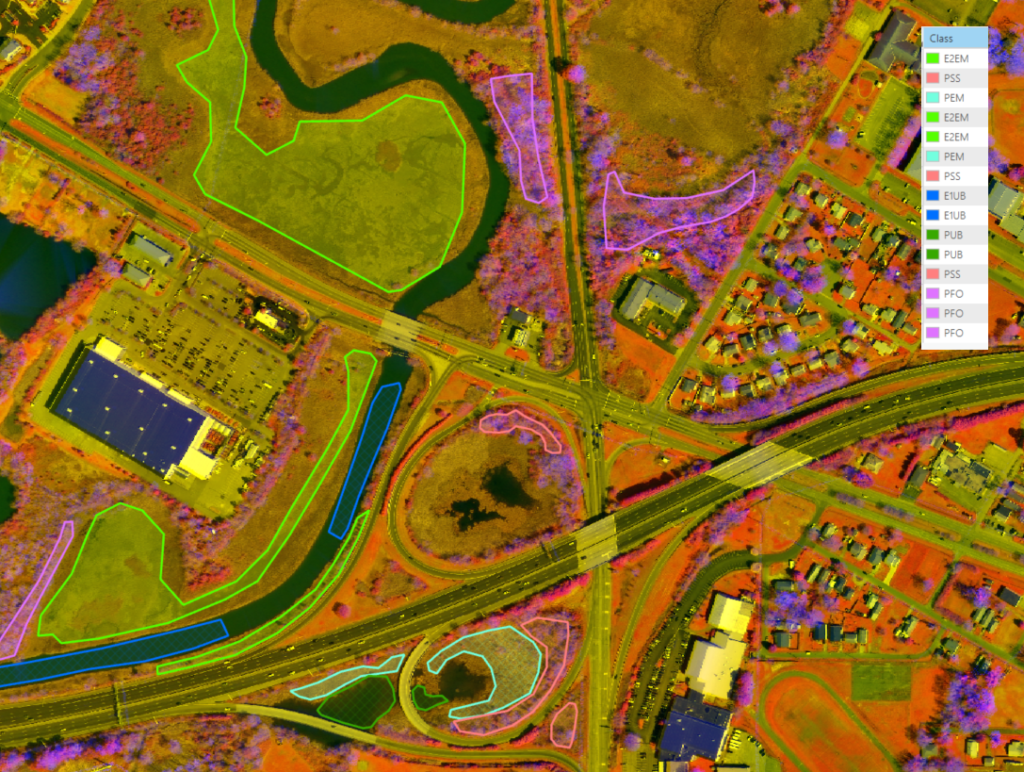
Then, in a nod to experts out-standing in their field, we wanted to give wetland delineators something to think about – the remote sensing of wetlands as a cost-effective solution to a traditionally labor-intensive process. Lots of promise, and lots of fun with our friends at the Virginia Department of Transportation (VDOT).