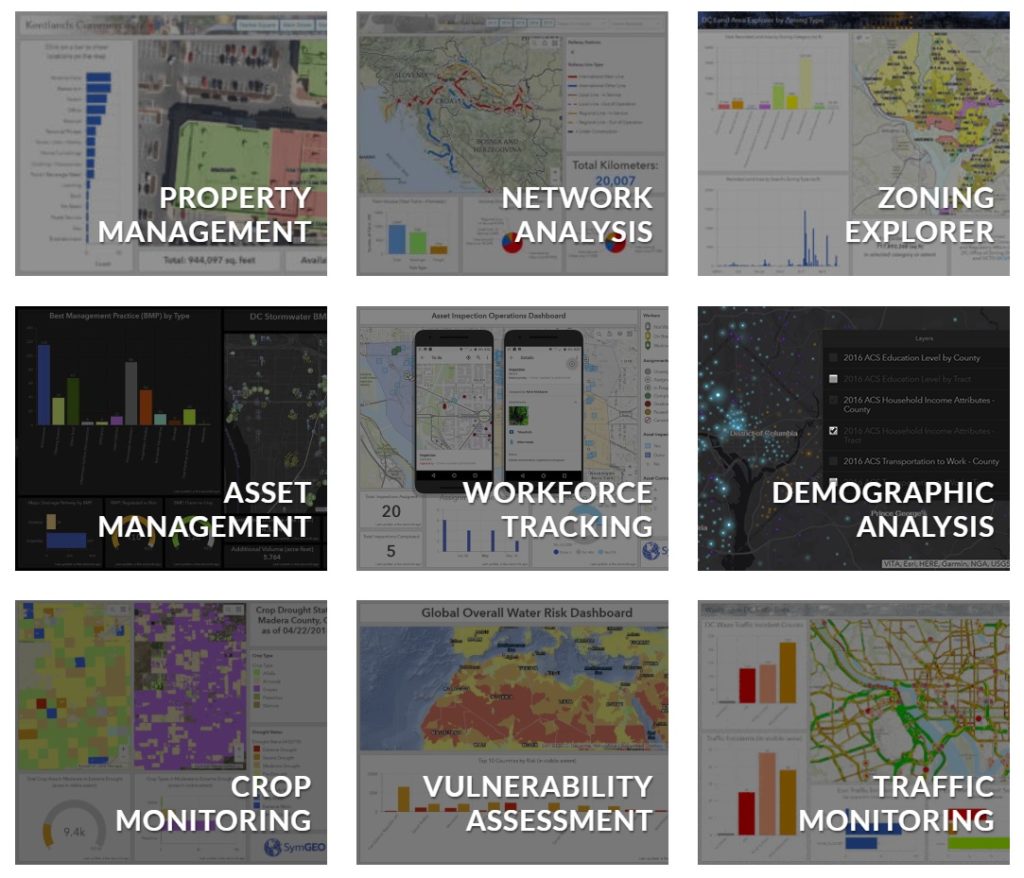
At SymGEO, we love our dashboards! What better way to present interactive and actionable data, styled to perfection and updated in near real-time? This month we thought we’d take a look at some of the dashboards that we’ve configured over the past year, as the technology has been improving rapidly!
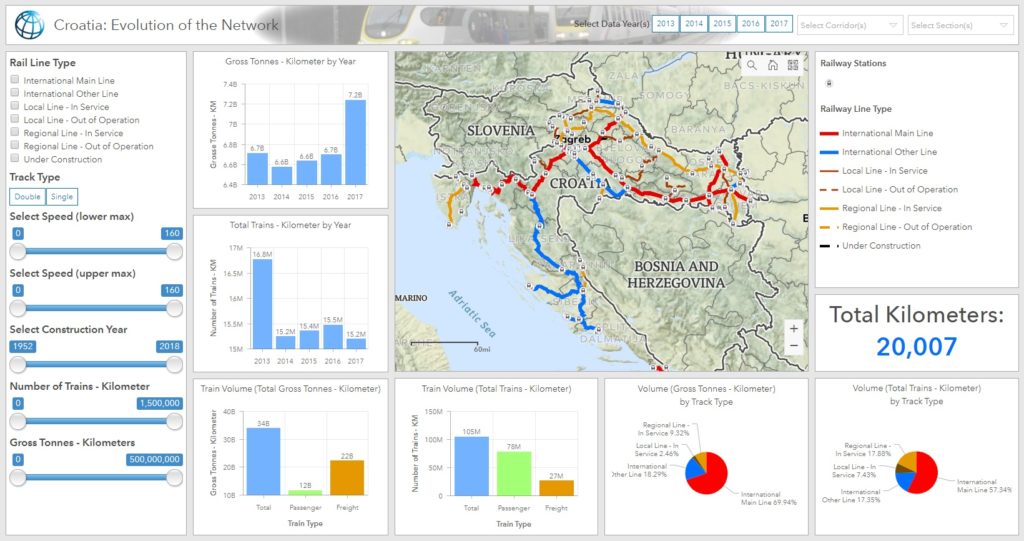
The newest member of our dashboard family was created for the World Bank to help analyze the rail network in Croatia. What started as a number of spreadsheets and a dream, turned into a fully interactive site that will help Croatia identify risk and prioritize upgrades to their network.
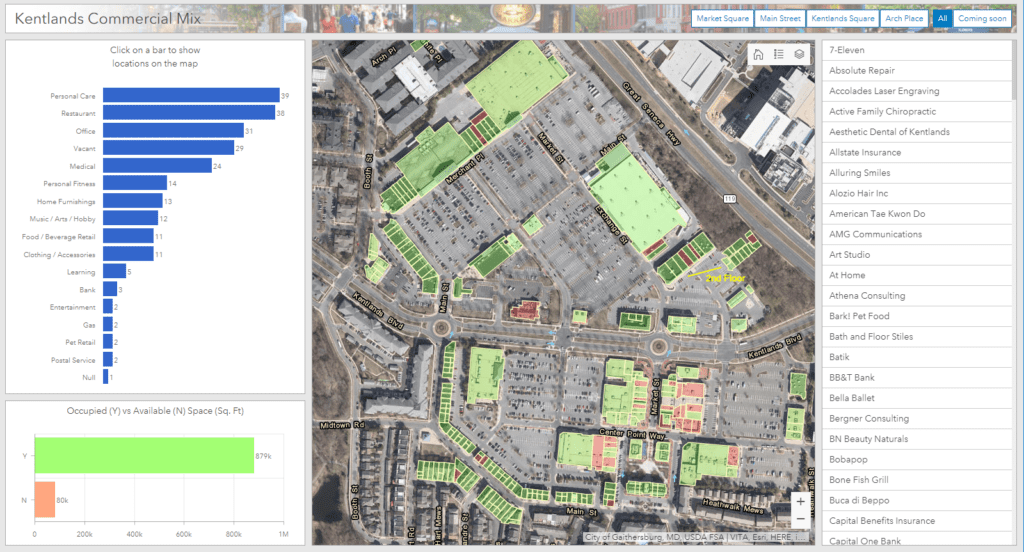
Keeping track of hundreds of commercial properties and identifying retail opportunities through gap analysis is fun and easy with configurable dashboards.
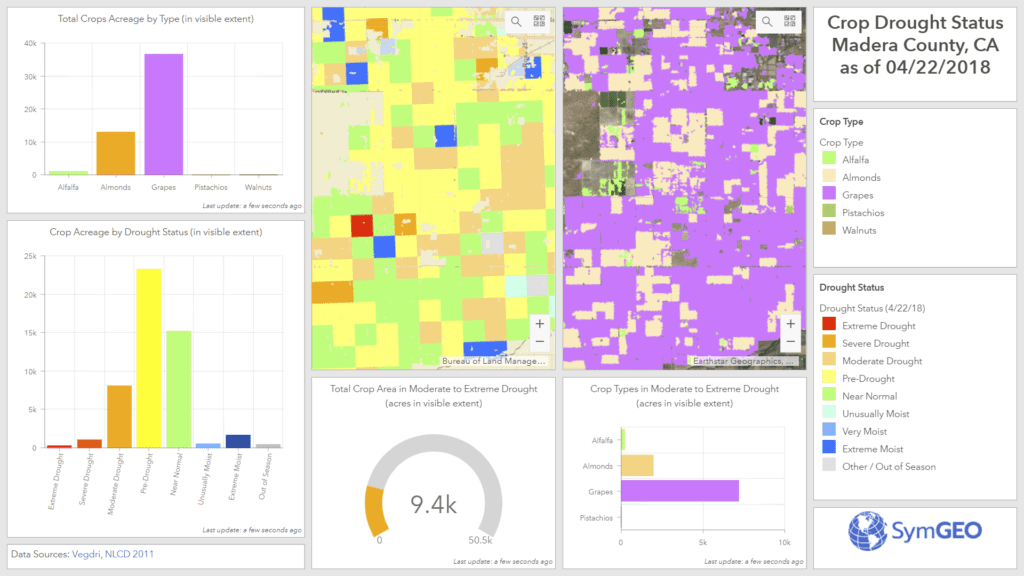
Incorporating remotely-sensed drought information is key to informed water use and allocation decisions in arid areas of the country. Help your district save time, money, and natural resources!
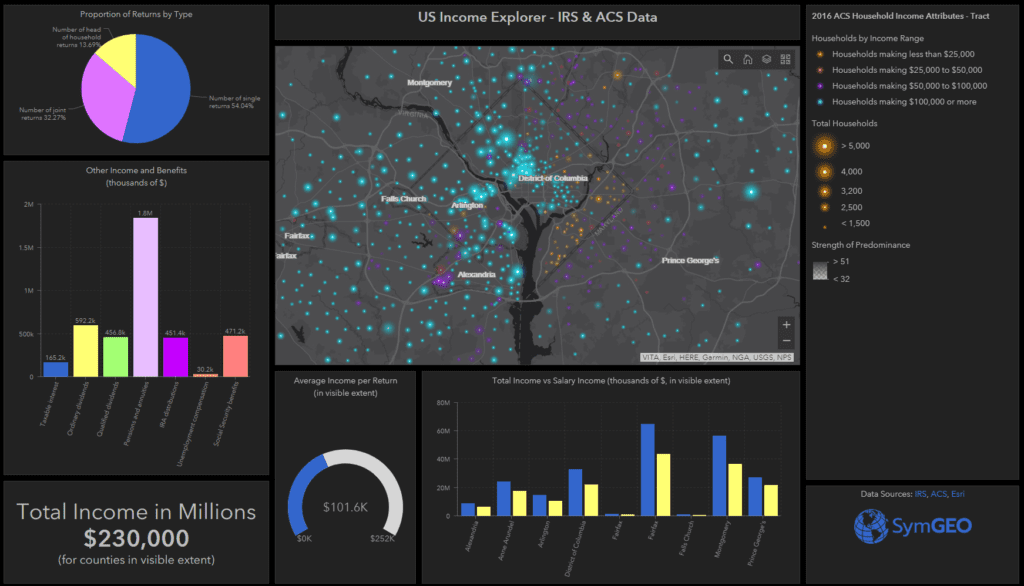
Integrating data from a number of sources such as IRS, Census, Esri, and others allows beautiful visualizations of neighborhood demographics and statistics.
Check out a selection of our dashboards here, or contact SymGEO with project ideas.
From all of us at SymGEO, enjoy the holiday season!
