Croatia Rail Dashboard in ArcNews

We are excited and honored to announce that our World Bank asset management work in Croatia has been published in ArcNews Spring 2020 edition! We had lots of fun crunching data, solving international geospatial mysteries, and leveraging ArcGIS Dashboard and ArcGIS Pro capabilities. It’s not every day that our work is featured in front of an audience of 900,000 GIS professionals, so come see what all the excitement is about!

Check out the article to learn all about this project and let us know if SymGEO can help you leverage your spatial data with an ArcGIS Dashboard.

Croatia Rail Esri Case Study

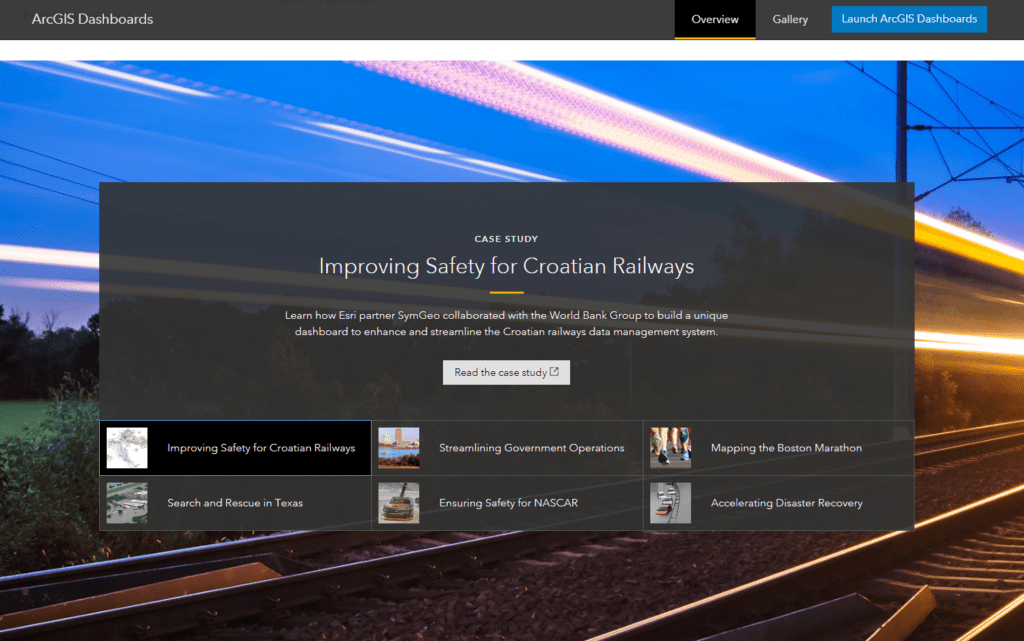
SymGEO is honored to have our World Bank asset management work in Croatia featured as a successful case study by Esri! We had lots of fun crunching data, solving geospatial mysteries, and leveraging ArcGIS Dashboard and ArcGIS Pro capabilities.

operations dashboard case study

This solution was also featured on the ArcGIS Dashboard product page as a good example of what can be done with this flexible and powerful technology.

Check out the case study and let us know what you think!

Hub Specialty Designation

SymGEO is pleased to announce we have been awarded the ArcGIS Hub Specialty designation from Esri! This prestigious honor is bestowed upon partners to recognize their expertise and delivery of solutions and services that help customers build a bridge between government departments and communities using ArcGIS Hub technology.

“ArcGIS Hub is an easy-to-configure cloud platform that organizes people, data, and tools to accomplish Initiatives and goals.” – Esri

SymGEO has been fortunate to work on community engagement projects for municipal and local government clients and has enhanced our partnership with Esri to gain valuable insight into best practices and emerging Hub technologies. We work diligently with our clients to identify their core messaging, digital assets, targeted audience, and corporate branding. We then typically implement a Hub site comprised of pages and initiatives that feature a range of ArcGIS Online solutions, including Survey123, Web AppBuilder, ArcGIS Dashboard, Collector, and 3D WebScenes.

To show a sampling of our ArcGIS Hub work, we offer the following examples:

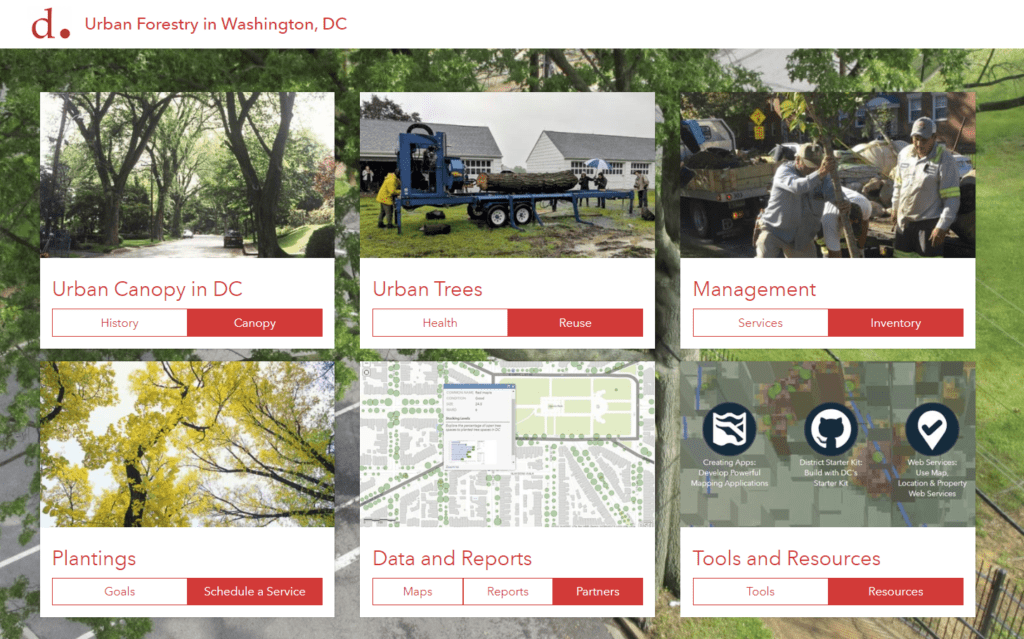
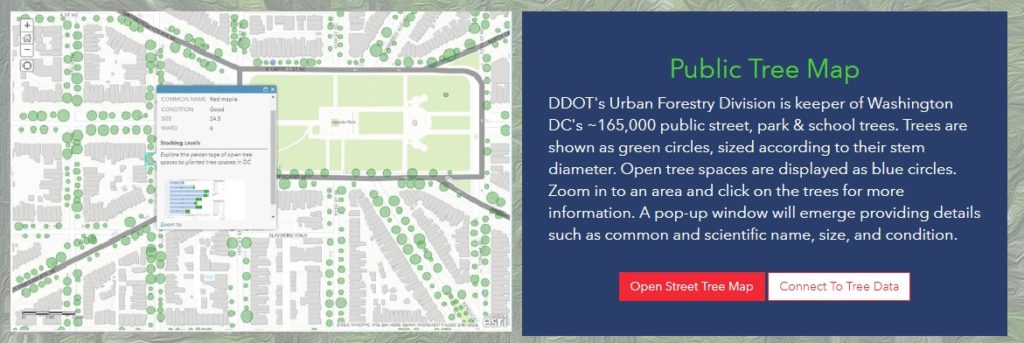
SymGEO partnered with the District Department of Transportation (DDOT) Urban Forestry Division (UFD) to build an ArcGIS Hub site that showcases their work, data, and configurable applications. Upon completion, we then developed an initiative for their group that features Urban Wood Reuse in Washington, DC. The site is designed for schools that are interested in ordering products from DDOT made from urban trees so that school children can appreciate the continued benefits of the urban forest. The site uses Survey123 to capture order information, and ArcGIS Dashboard (on the backend) to track request status as the orders are being processed. Most recently, we have made a page for their group that explores Urban Forest Health issues.

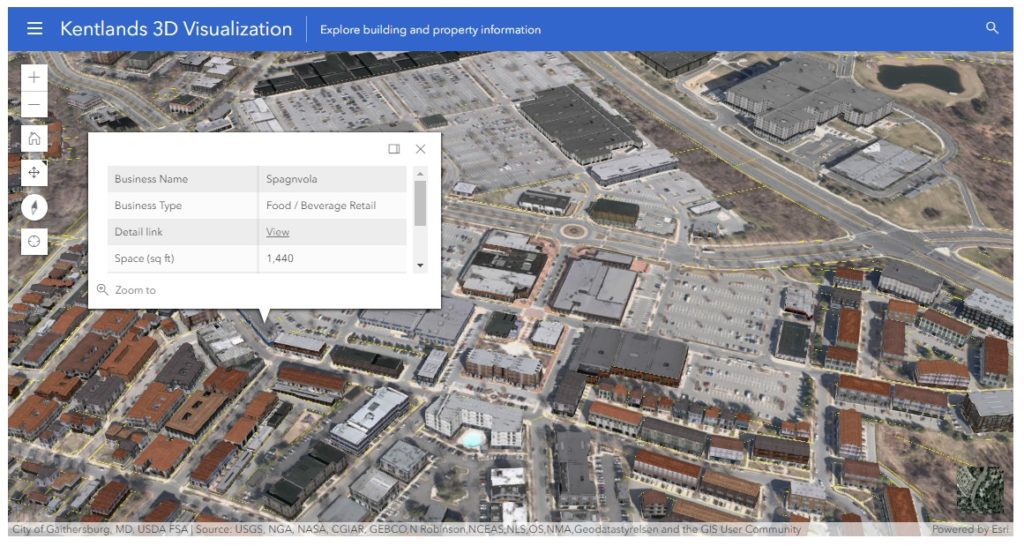
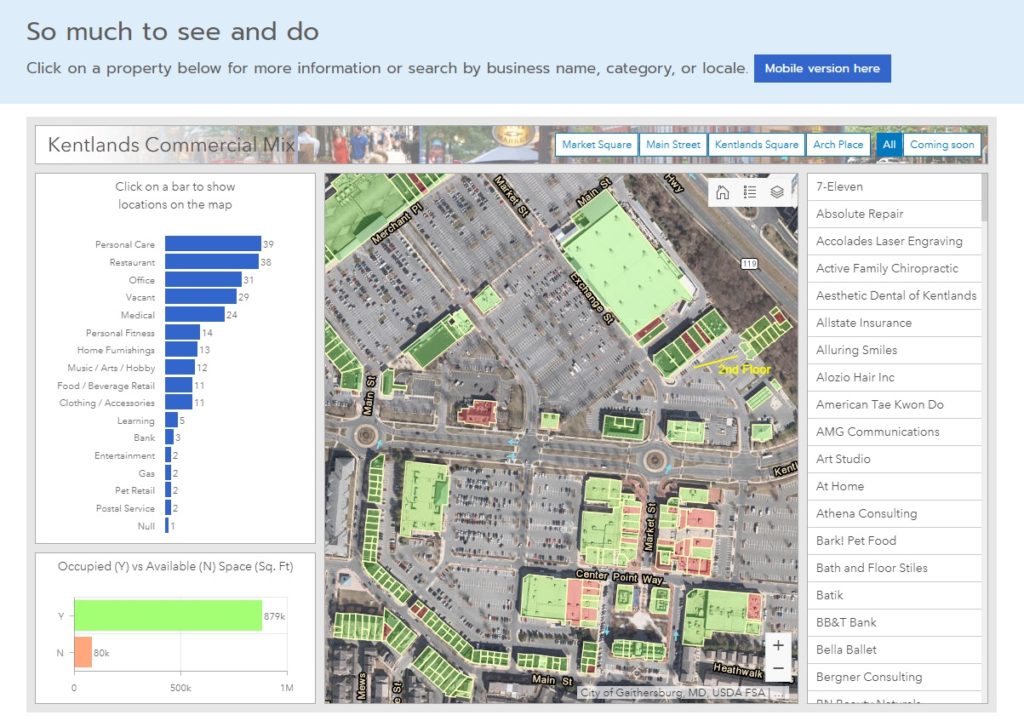
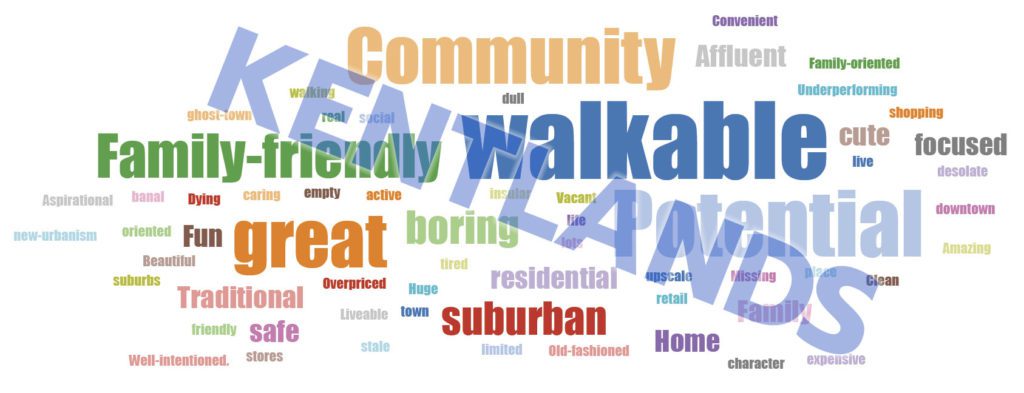
SymGEO worked with guidance from the Kentlands Downtown Working Group to develop Kentlands Downtown: Energize!, an ArcGIS Hub-powered site that aims to connect the community with the economic development team to voice their opinions on what would do well or is needed in the Kentlands. The site leverages Survey123, ArcGIS Dashboard, and a number of unique design elements, including a 3D “virtual” fly-through. The realistic textured 3D environment was developed using a Local Government solution (Local Government 3D Basemaps) that used building footprints, LiDAR data, and CityEngine.

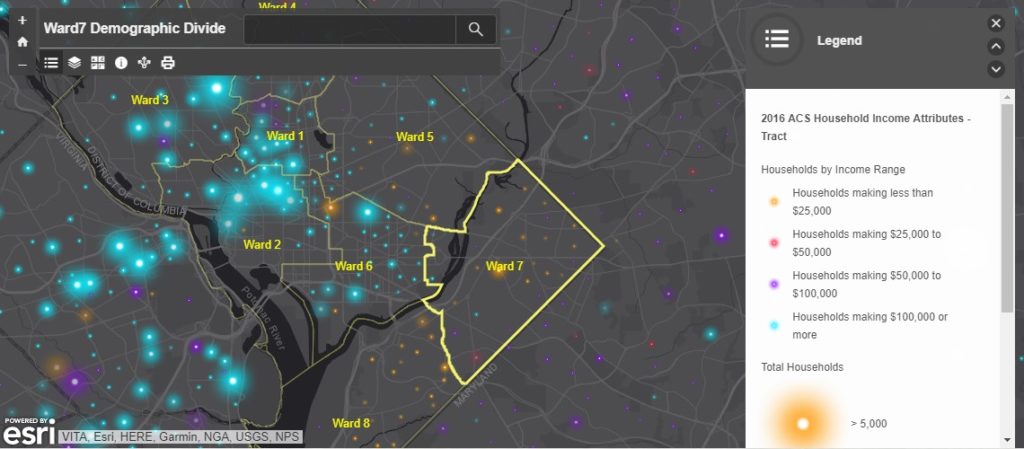
SymGEO was honored to partner with DC’s Ward7 to design and launch a community outreach site designed to present a brief history of the area, a flavor of the neighborhood, the challenges faced due to a changing development landscape, and a call to action for the residents. The site features a history of the development and a map showing the rather sharp economic divide between Ward7 and some of its surrounding neighborhoods.

SymGEO is focused on empowering state and local governments to better use their data and digital assets and to facilitate 2-way engagement with their constituents and communities. We leverage configurable Esri applications to deliver cost-effective solutions to our clients and pride ourselves on delivering a tailored, successful experience during each engagement. Talk to our industry experts today if your neighborhood, department, or organization is interested in community engagement with the power of Esri’s ArcGIS Hub technology – SymGEO is a certified specialist and is here to help!
Croatian Rail Network

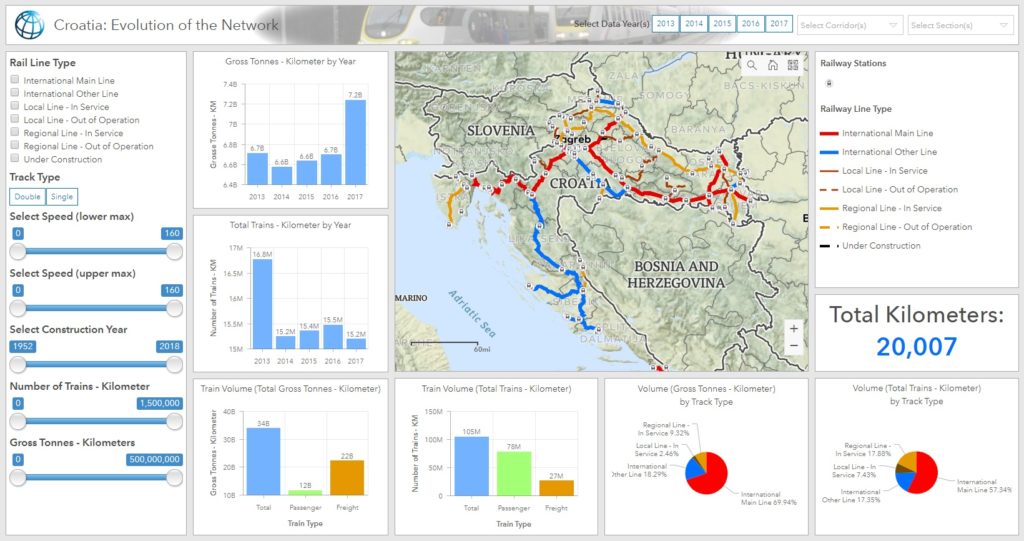
SymGEO is pleased to announce the completion of a project with The World Bank Group that enables valuable interactive insight into the rail transportation system in Croatia. This project has since been featured by Esri as a Case Study for dashboard best practices, and then featured in ArcNews as a success story entitled “World Bank Deploys GIS Dashboard to Improve Railway Safety in Croatia“.

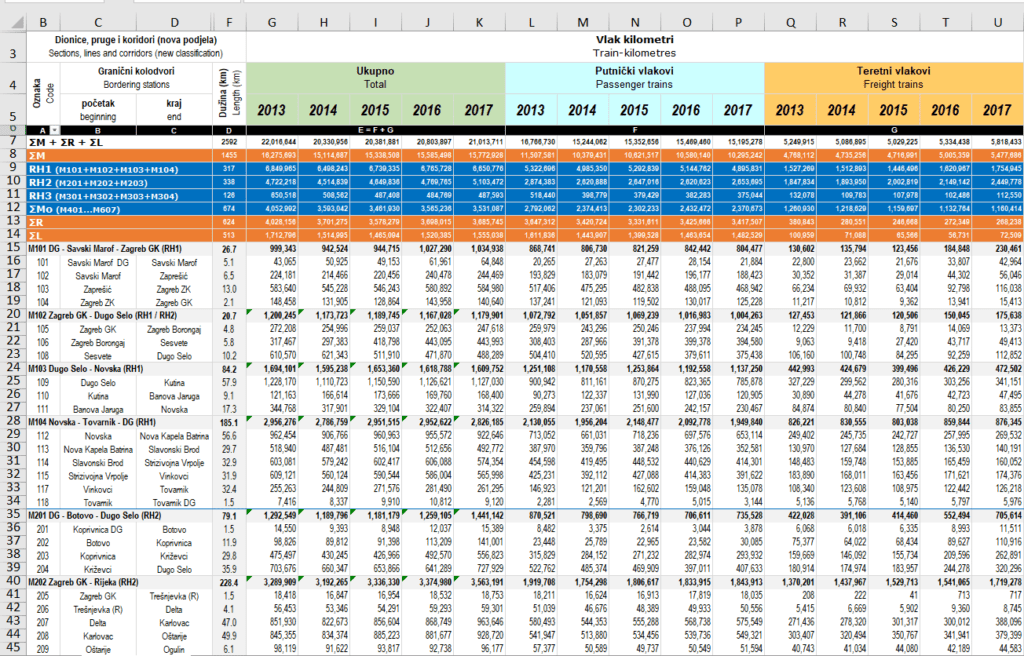
This project started from humble beginnings, with a series of excel files that detailed rail segment speed, passenger numbers, freight volumes, age of the track, and other characteristics.

croatia excel file

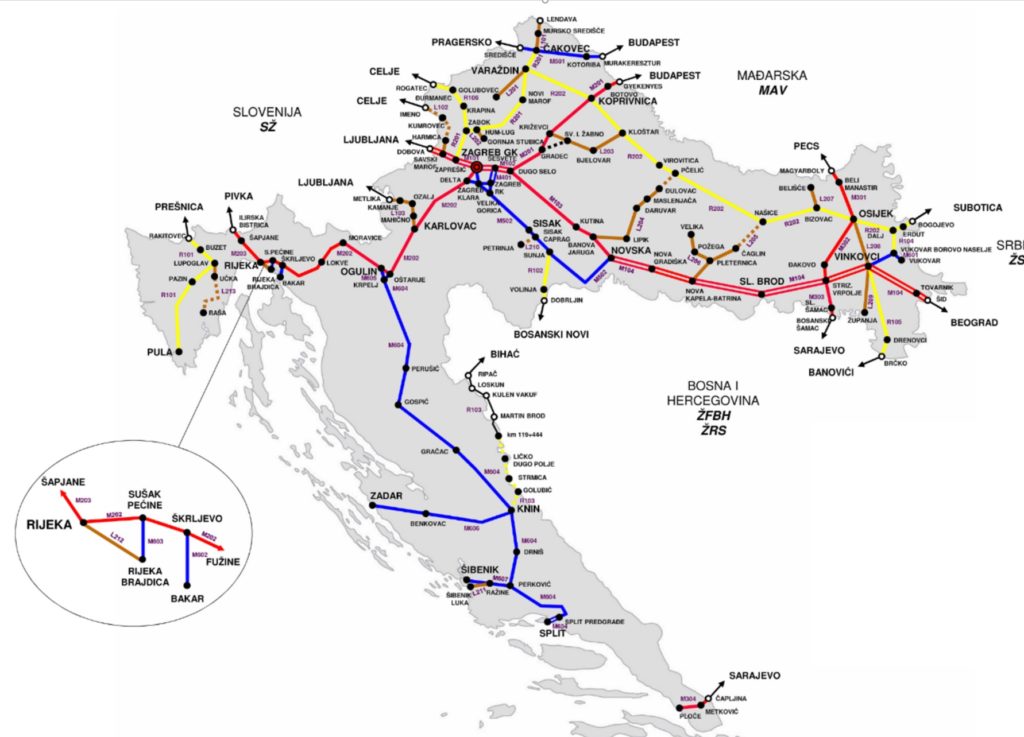
SymGEO then used a schematic diagram of the network to build and calibrate a spatially accurate network based on OpenStreetMap rail data and linear referencing of station locations.

croatia network diagram

This newly created spatial data was then hosted in ArcGIS Online and used to configure an ArcGIS Dashboard application. This application was specifically designed to filter and query the data interactively on demand and present summary statistics based on complex queries. This combination of attribute queries, summary statistics, and visual representation now enables report graphics and key decision data to be created on-the-fly by the client.

“This is superb and exactly what the client needed and what I was imagining.”

– World Bank client

If you have complex transportation network data that you’d like to leverage with an intuitive, user-friendly, configurable application, then SymGEO would love to hear from you!

SymGEO Hub in the News

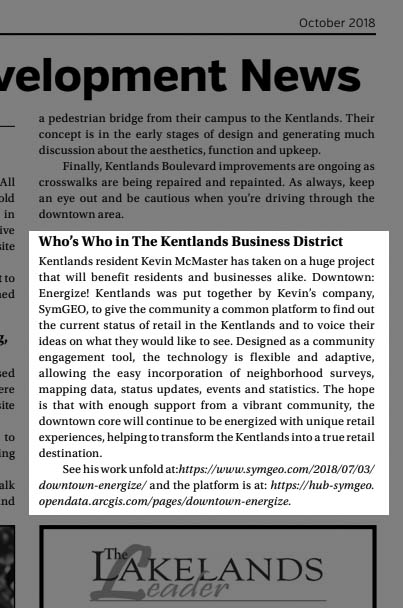
This month we were honored to have Downtown: Energize! featured in two local papers. There has been tremendous energy and enthusiasm swirling around this flagship project from SymGEO, and the technology continues to improve with every update.

lakelands newspaper

Downtown: Energize! features many different components of the ArcGIS technology suite, including Survey123, GeoForm / Collector, ArcGIS Dashboard, Web AppBuilder for the retail locator, and a web scene that uses CityEngine textured models derived from building footprints and Lidar information processed in ArcGIS Pro. These components are then hosted in ArcGIS Online and leveraged using ArcGIS Hub technology.

downtown energize banner

Two local development boards, the Kentlands Downtown Working Group (KDWG) and the One Main Street Initiative (OMSI), took an excited interest in Downtown: Energize! and have commissioned complimentary sites to be built using Hub technology. The commercial real-estate management of the site is especially useful in a fast-paced environment!

kentlands newspaper

“The KDWG was commissioned by the Kentlands board to provide accurate and timely information on the various development efforts going on with our downtown so residents can be better informed and take a more active role in improving our community. We chose the Downtown: Energize! platform developed by SymGEO with its innovative digital mapping because it helps do exactly that.”

– John Ingrassia, Chair, Kentlands Downtown Working Group

“A great commercial district is a huge amenity for our community. Downtown: Energize! is a great digital tool for helping the community achieve the vision for our commercial district. Not only will it help us engage the community to provide flexible two-way dialogue, but it will help us by mapping opportunities where businesses can expand and thrive. This innovative platform will allow us to easily update data, access data and provide data well beyond our community, which provides outreach to businesses looking to expand. Additionally, it is a fun way to empower consumers looking for a place to spend their precious free time to engage with this easy to use tool whether at home or mobile. Working with Kevin at SymGEO has been an amazing experience. He and his team are bringing tremendous innovations and ideas to our team at The One Mainstreet Initiative.”

– Neil Burka, Chair, One Main Street Initiative

“I was so excited when SymGEO came to us with this idea. As a local real estate agent and resident who is deeply engaged in the community, I understand on a personal level how important this spatial data is to get the community engaged and onboard with what’s happening. This platform will make it easy to access the data – especially for folks who, like me, are more visual.”

– Sheena Saydam, Realtor, Keller Williams Capital Properties, Member, Kentlands Downtown Working Group

“Downtown: Energize! as created by Kevin McMaster using the SymGEO platform, is an innovative digital tool that provides mapping of business locations to potential and existing customers in a format that is fun, easy to use, and flexible enough to accept updates and even track current events. It’s a win-win for our community by empowering residents to engage with our local businesses and to energize our downtown!”

– Ingrid L. Fraley, Local Business Owner – Design Services, Inc.

kentlands 3d

If you’d like to join the party with a Downtown: Energize! initiative, let us know as SymGEO is here to help!

Land Area by Zoning

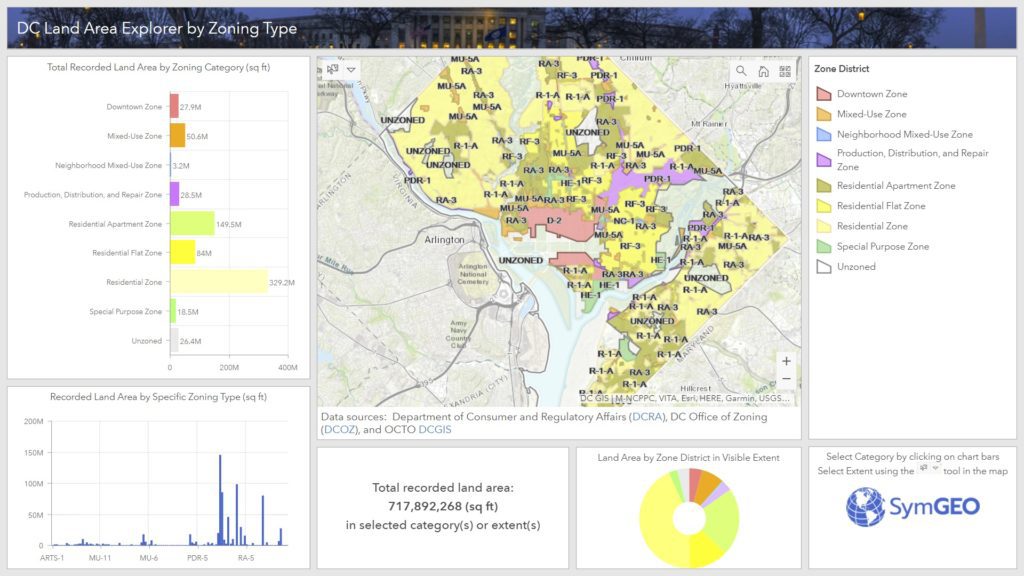
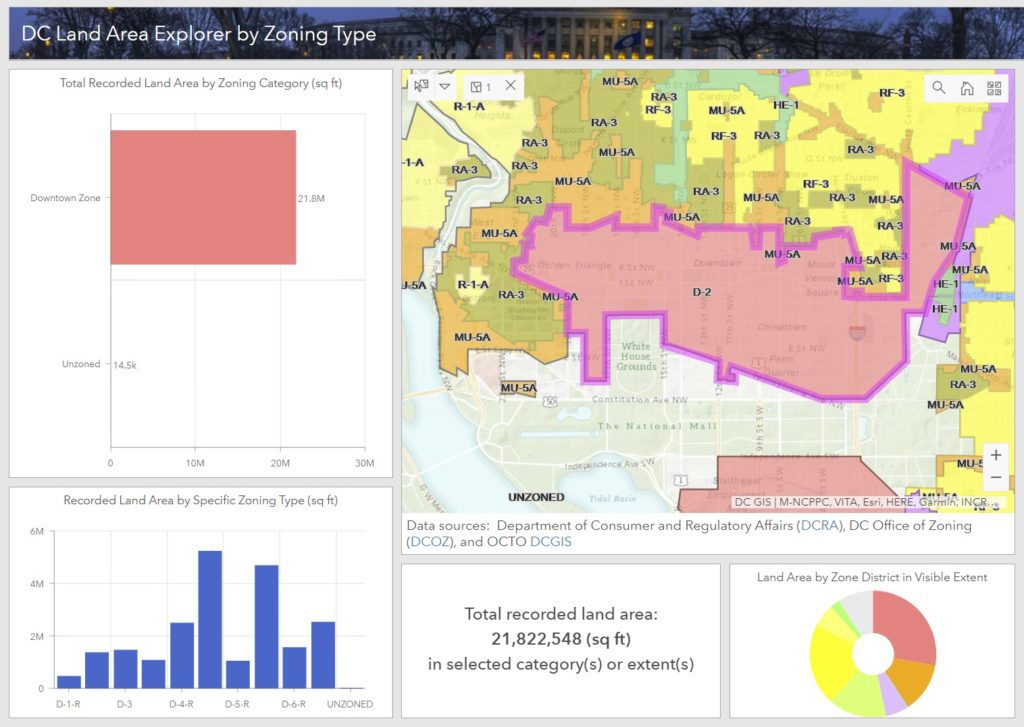
Ever wonder how much land area there is in DC by zoning district or specific zone? Well, wonder no more, as we sliced and diced the data, and created the DC Land Area Explorer by Zoning Type. This application leverages Esri‘s select by chart category functionality in ArcGIS dashboard. Data is kindly provided by our friends at DC Office of Zoning (DCOZ),  the Department of Consumer and Regulatory Affairs (DCRA), and a fabulous basemap by OCTO’s DCGIS team.

Users can select zoning categories or specific zones by clicking on the bars in the charts. This will update the total recorded land area calculation to just the selected zone(s). Alternatively, for really detailed analysis, zooming into the map and using the “select” tool in the map window allows the selection by zoning district, specific zone, or even property boundaries.

Take a look at the DC Land Area Explorer by Zoning Type, and if you have data you’d like sliced, diced, sauteed or… you know who to contact!

Stormwater BMPs in DC

Did you know that when heavy rain falls in an urban environment, most of it will run off the roads and buildings into concrete channels and quickly dump into streams and rivers? This “stormwater” can be very damaging, as all the water enters into the streams at virtually the same time, so channel erosion and water quality are serious concerns. In natural environments, the water is slowed down and filtered by things like trees, wetlands, soaking into the ground and moving through the landscape.

To help mimic the function of the natural environment, urban planners and municipal engineers construct stormwater “Best Management Practices” (or BMPs) to help filter and slow down the water on its way to the nearest stream. Stormwater BMPs may include structures such as reservoirs, green roofs, permeable pavement, filtering ponds, or rainwater harvesting among others.

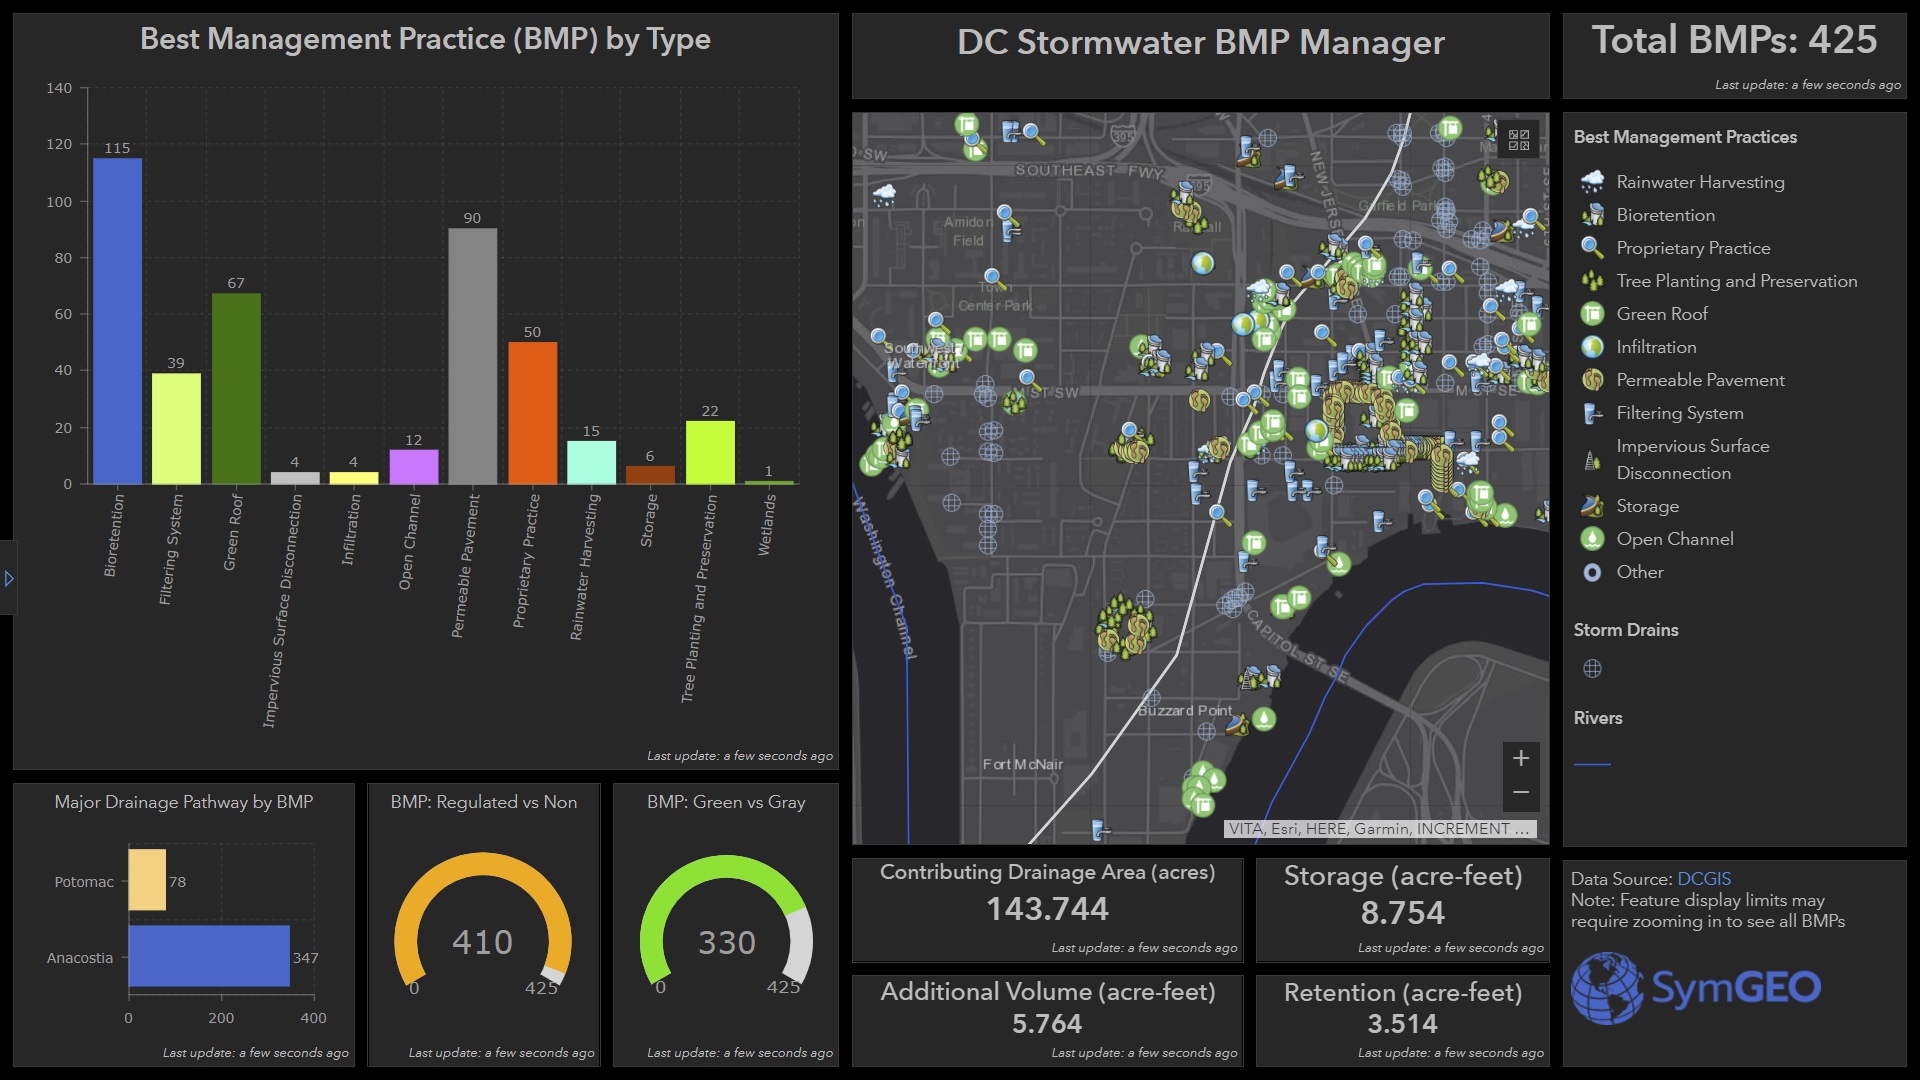
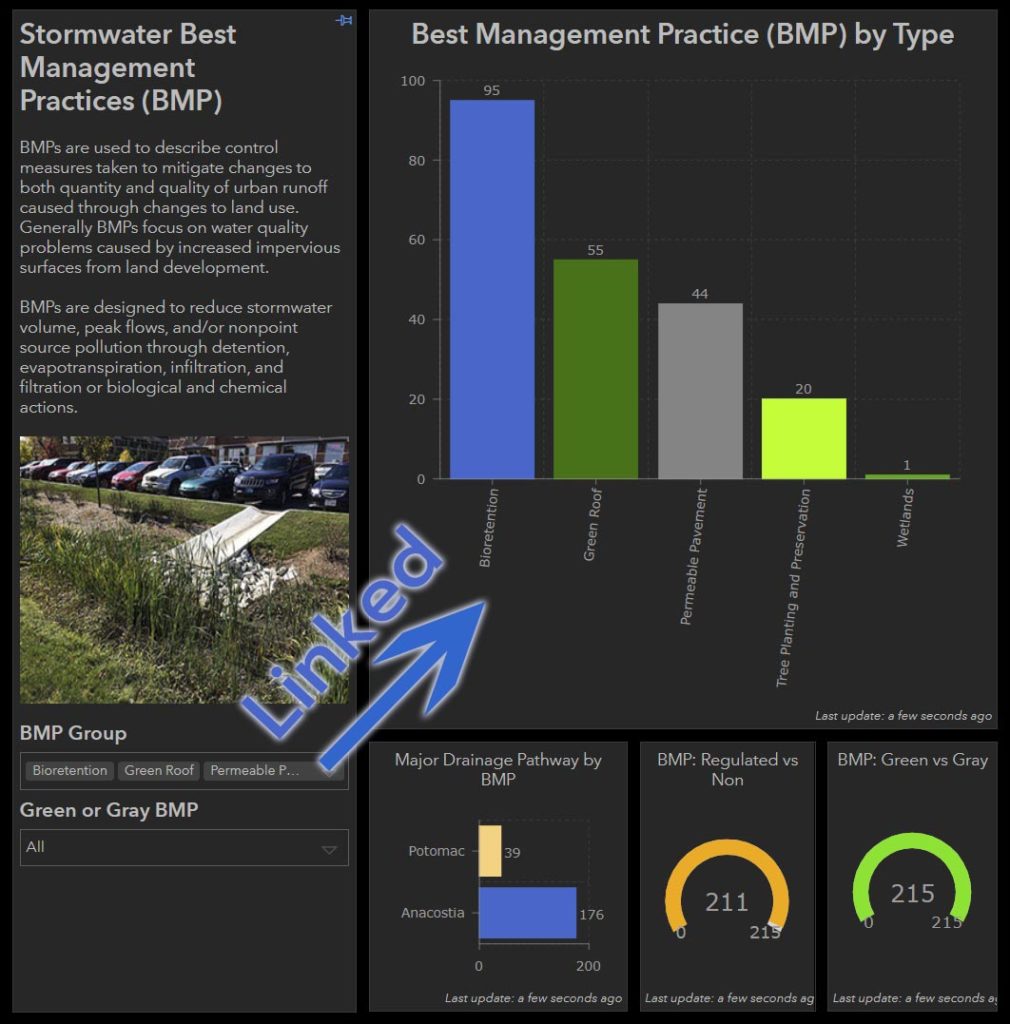
Keeping track of all those stormwater BMP assets is a challenge, so SymGEO has built the DC Stormwater BMP Manager to help. This configurable application uses an ArcGIS Dashboard template, and shows a select set of data attributes to display the characteristics and capabilities of local stormwater BMPs.

The data is coming directly from DC OCTO / DCGIS data servers, shared through Open Data DC. This powers the application with the authoritative data sets, and any updates to the data are immediately reflected in the manager dashboard. All statistics are calculated based on the stormwater BMPs within the view window, allowing interactive explorations around the city.

If only a certain subset of data is to be investigated (say by BMP type, or by green vs gray infrastructure), a left-hand panel can be opened to filter the data. All statistics and the map window are linked to those filters, and additional data about each BMP can be accessed by clicking on the BMP feature.

Give the DC Stormwater BMP Manager a spin, and imagine the possibilities using your own data. Contact us for more information on how to effectively display and share your digital assets!

Global Water Risk Dashboard

SymGEO is pleased to share a free and interactive Global Water Risk Dashboard to help inform policy decisions on water risk and spark international discussion around the world. Powered by Esri’s ArcGIS dashboard technology, this configurable application is based on population data provided by CIESIN, overall water risk data from Water Resources Institute, and country boundary data from GADM.

From WRI: “Overall water risk identifies areas with higher exposure to water-related risks and is an aggregated measure of all selected indicators from the Physical Quantity, Quality and Regulatory & Reputational Risk categories. Physical risks related to quantity identify areas of concern regarding water quantity (e.g. droughts or floods) that may impact short or long term water availability. Physical risks related to quality identify areas of concern regarding water quality that may impact short or long term water availability. Regulatory and reputational risks identify areas of concern regarding uncertainty in regulatory change, as well as conflicts with the public regarding water issues.”

These data sets can be explored in detail in the WRI’s Aqueduct application.

The data was processed in ArcGIS Pro to aggregate the number of people in each country by overall risk category using zonal statistics. Once processed and symbolized, the data was then published and hosted in ArcGIS online, from which the Operation Dashboard was constructed. Charts and numerical summaries update interactively based on the map window extents, and clicking on a country of interest reveals detailed overall water risk data for that country.

Check out the Global Water Risk Dashboard today and let us know what you think!