COVID-19 Honduras

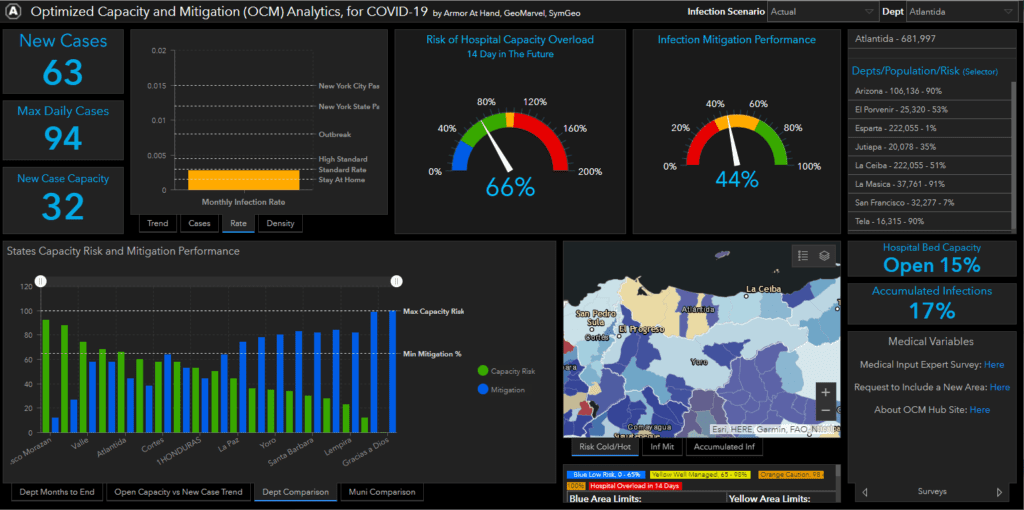
When our collaborative partners at Armor at Hand asked us if we were willing to continue our pro-bono work to fight the devastating effects of COVID-19 and help the people of Honduras, we didn’t hesitate. The result of this international work can now be seen in the Optimized Capacity and Mitigation (OCM) Honduras Dashboard.

This dashboard leverages data specific to Honduras and is a variant of the US version. This required significant updates to the modeling process and data files as well as a reconfiguration of the dashboard to reference the new data schemas. ArcGIS Online Assistant was used to facilitate the substitution of ArcGIS web maps and data services, and a new python script was developed to keep the Honduras data current.

For more information about the data model developed by Armor at Hand that powers the dashboard, check out the OCM Hub page, OCM whitepaper, or OCM ArcGIS Marketplace listing.

Talk to our industry experts today to help you leverage your spatial data with an ArcGIS Dashboard, ArcGIS Hub site, or the ModelBuilder process – SymGEO is here to help!
COVID-19 Mitigation Analytics

Returning to “normal” after (or during) a global pandemic is a complicated prospect. Finding the right balance between the potential rate of infection based on social distancing scenarios versus hospital capacity to handle projected cases requires advanced spatial modeling and analytics. Needless to say, when SymGEO was asked to help our national recovery effort by our respected peers in the industry, GeoMarvel and Armor at Hand, we were happy to do as much as possible to assist.

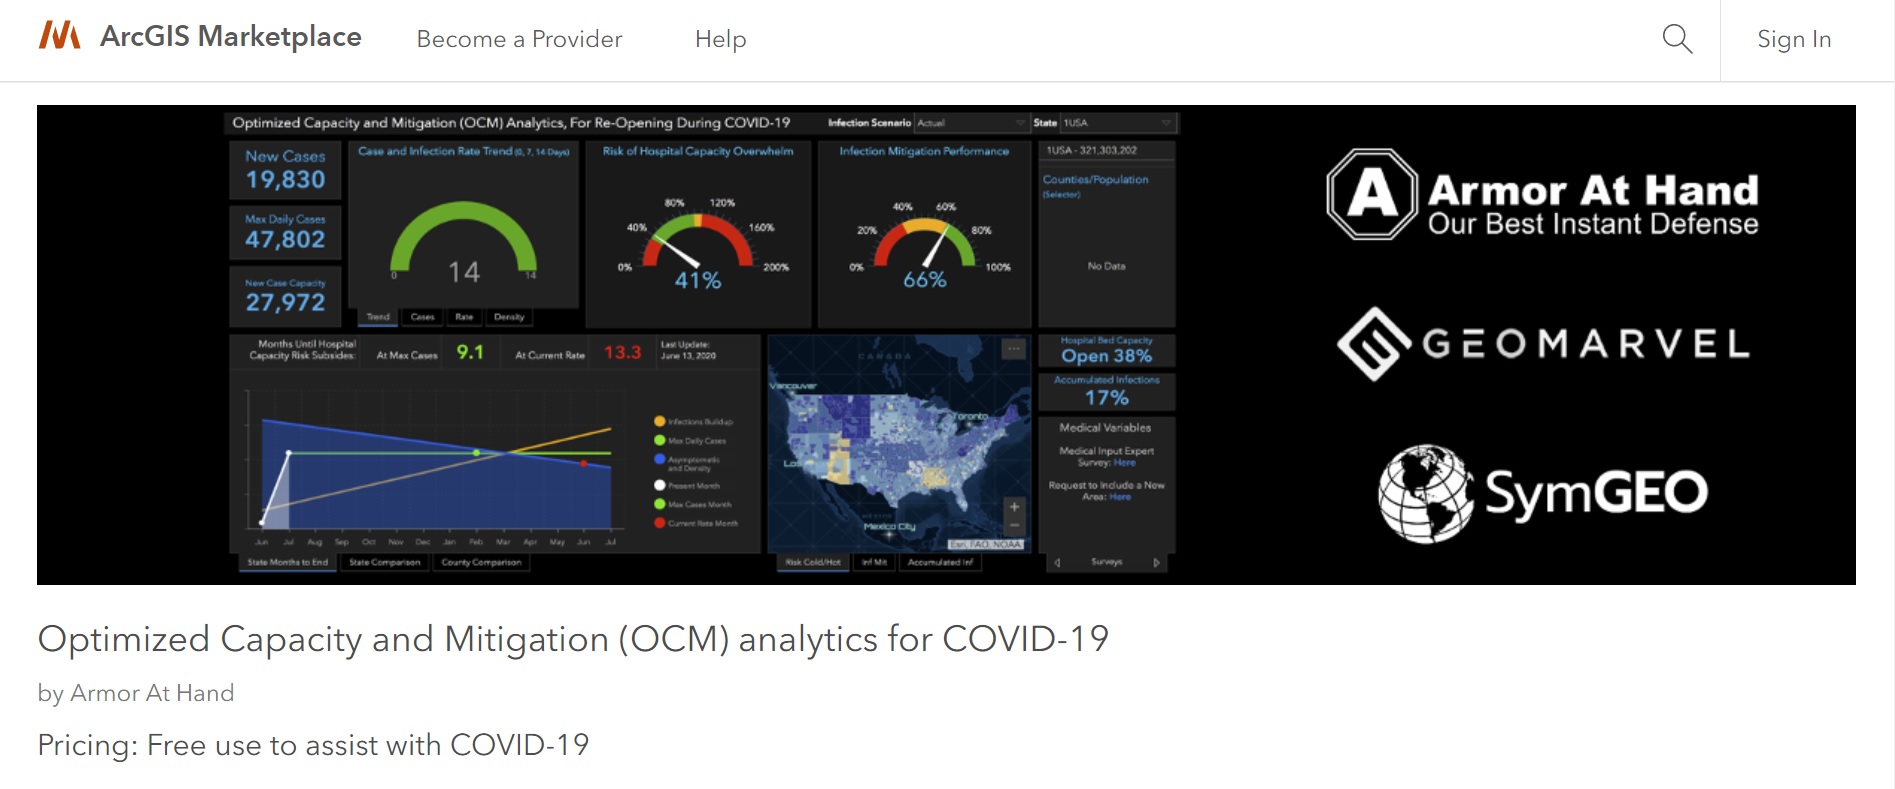
The result of this collaboration is the Optimized Capacity and Mitigation (OCM) Analytics Dashboard, free for use in the ArcGIS Marketplace to assist with COVID-19 mitigation efforts. This dashboard is designed to use current hospital capacity data, infection rate scenarios based on demonstrated or projected epidemiology statistics, and peer-reviewed variable modeling methods. The history of this project is described on the OCM ArcGIS Hub site and summarized in an informative OCM whitepaper.

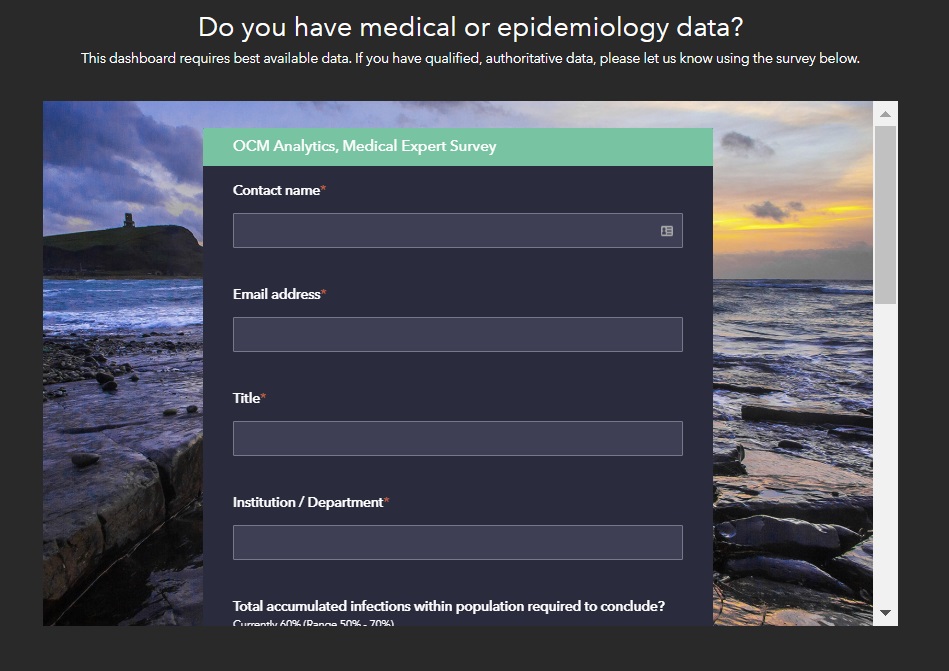
As modeling scenarios become more sophisticated and our understanding of infection rates is improved, this information can be used to augment the dashboard results. This information can be submitted by subject matter experts through an integrated survey on the ArcGIS Hub site.

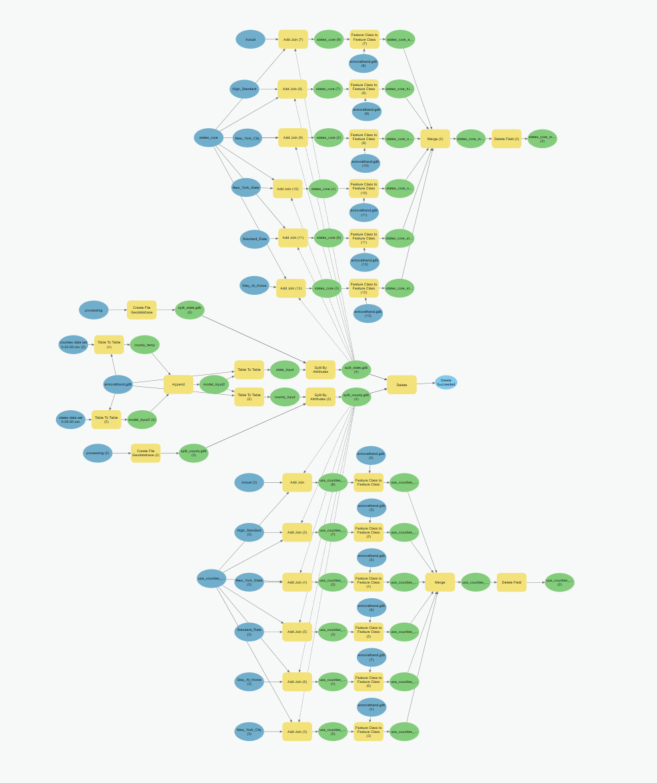
ArcGIS Pro ModelBuilder was used to facilitate and standardize the modeling updates and data tables used by the dashboard. The model was then converted into a Python script, designed to be run as needed to keep the data current and informative.

Check out the OCM Dashboard, OCM Hub page, or OCM ArcGIS Marketplace listing to learn all about this project and let us know if SymGEO can help you leverage your spatial data with an ArcGIS Dashboard, ArcGIS Hub site, or the ModelBuilder process.

Croatia Rail Dashboard in ArcNews

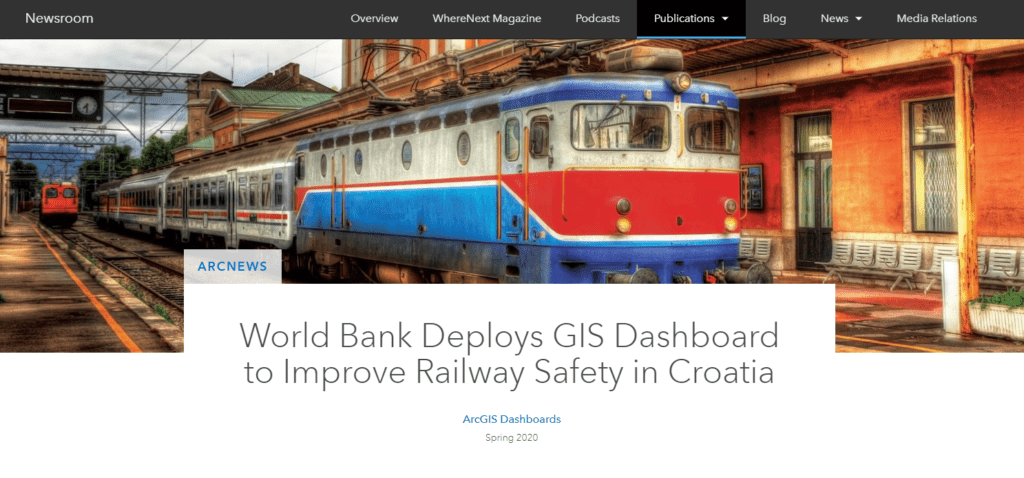
We are excited and honored to announce that our World Bank asset management work in Croatia has been published in ArcNews Spring 2020 edition! We had lots of fun crunching data, solving international geospatial mysteries, and leveraging ArcGIS Dashboard and ArcGIS Pro capabilities. It’s not every day that our work is featured in front of an audience of 900,000 GIS professionals, so come see what all the excitement is about!

Check out the article to learn all about this project and let us know if SymGEO can help you leverage your spatial data with an ArcGIS Dashboard.

Croatia Rail Esri Case Study

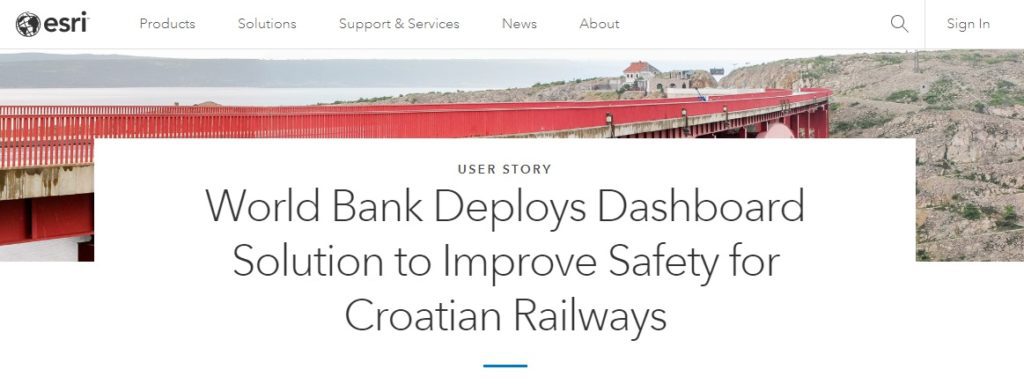
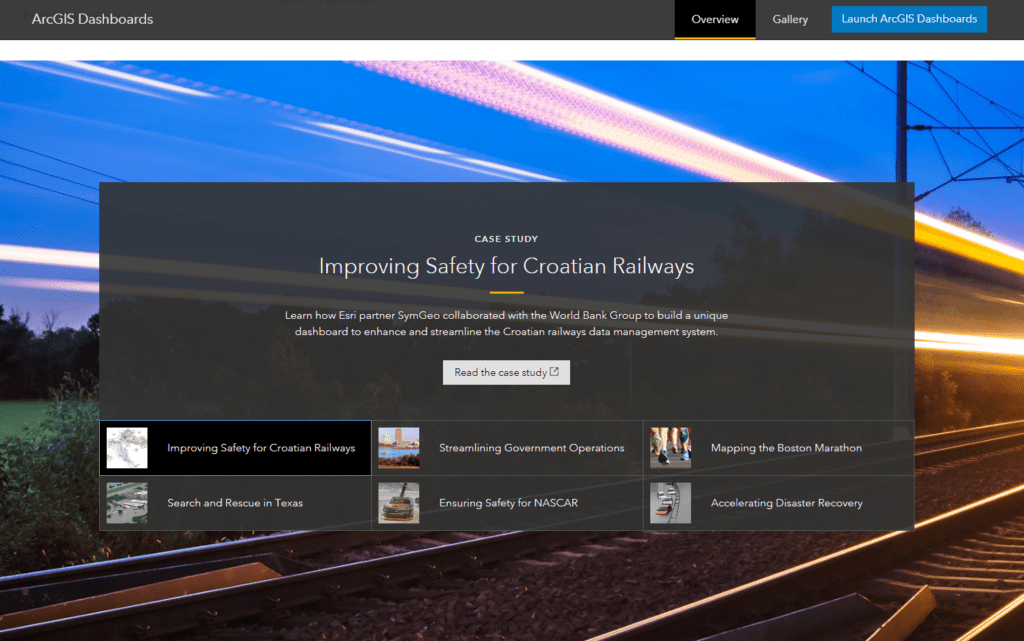
SymGEO is honored to have our World Bank asset management work in Croatia featured as a successful case study by Esri! We had lots of fun crunching data, solving geospatial mysteries, and leveraging ArcGIS Dashboard and ArcGIS Pro capabilities.

operations dashboard case study

This solution was also featured on the ArcGIS Dashboard product page as a good example of what can be done with this flexible and powerful technology.

Check out the case study and let us know what you think!

Manage Your Workforce

Do you have a mobile workforce in charge of inspecting, maintaining or interacting with assets? Watering trees, inspecting signs, putting up flyers, or targeted fundraising activities? If so, there is a new technology from Esri called Workforce that has your name all over it.

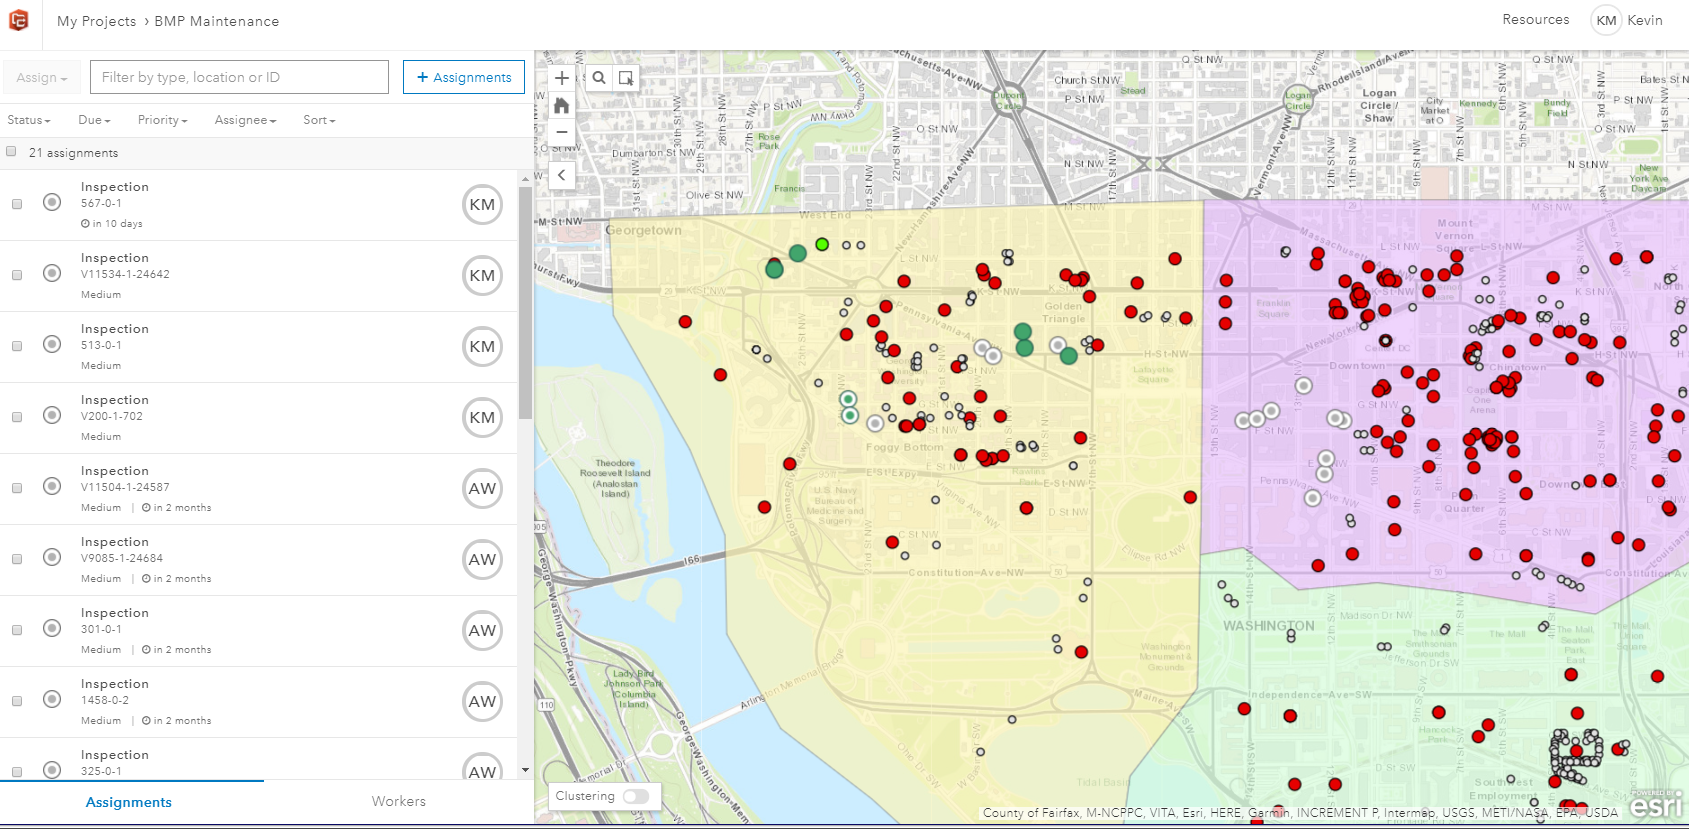
Beginning with asset data hosted in ArcGIS Online, a series of filters and queries can be used to determine which assets need to be assigned to your workforce. These might be assets over a certain age due for inspection, or locations where an issue has been reported. Assignments are made to named individuals in your ArcGIS organization, and contain information including location, priority level and due dates.

workforce project

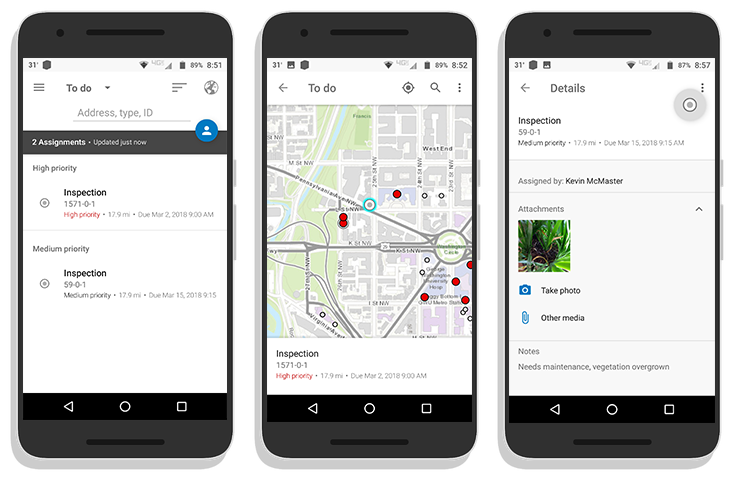
The assignments are then pushed to the mobile devices of your workforce, where they accept, navigate to, and complete the assignments. This may entail entering in notes, or taking pictures, and updating the assignment status. This information is sent back to the centralized cloud-based ArcGIS Online database in near real-time in a connected environment, or upon data synchronization if out of cell / wi-fi range.

workforce phones

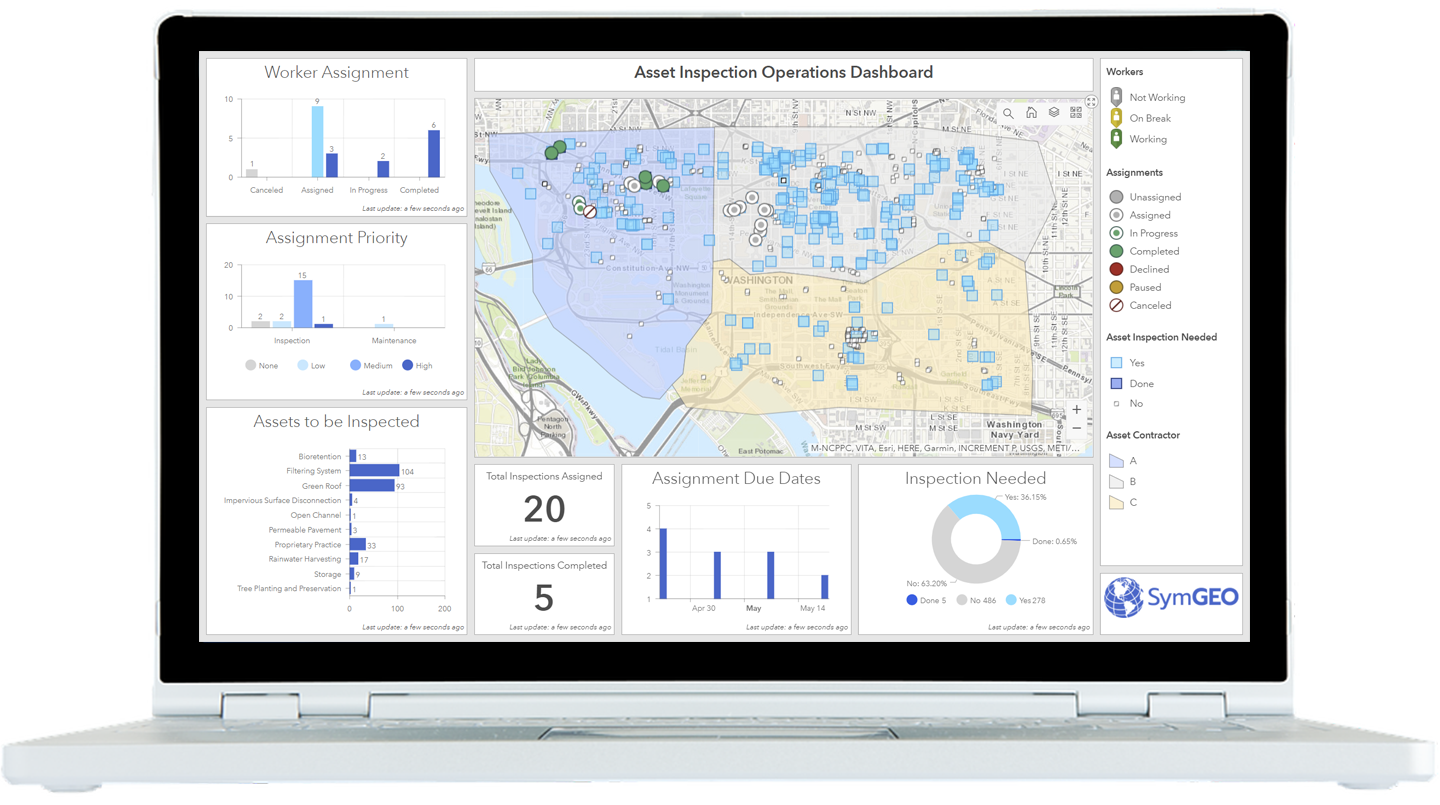
Back in the office, the workforce administrator can use the information to check worker progress, see current worker status and location, and re-allocate resources if needed. The information is easily aggregated and displayed using a dashboard or configurable web application.

If you’d like a hand getting set up, let us know, and SymGEO will put Workforce to work for you!

Stormwater BMPs in DC

Did you know that when heavy rain falls in an urban environment, most of it will run off the roads and buildings into concrete channels and quickly dump into streams and rivers? This “stormwater” can be very damaging, as all the water enters into the streams at virtually the same time, so channel erosion and water quality are serious concerns. In natural environments, the water is slowed down and filtered by things like trees, wetlands, soaking into the ground and moving through the landscape.

To help mimic the function of the natural environment, urban planners and municipal engineers construct stormwater “Best Management Practices” (or BMPs) to help filter and slow down the water on its way to the nearest stream. Stormwater BMPs may include structures such as reservoirs, green roofs, permeable pavement, filtering ponds, or rainwater harvesting among others.

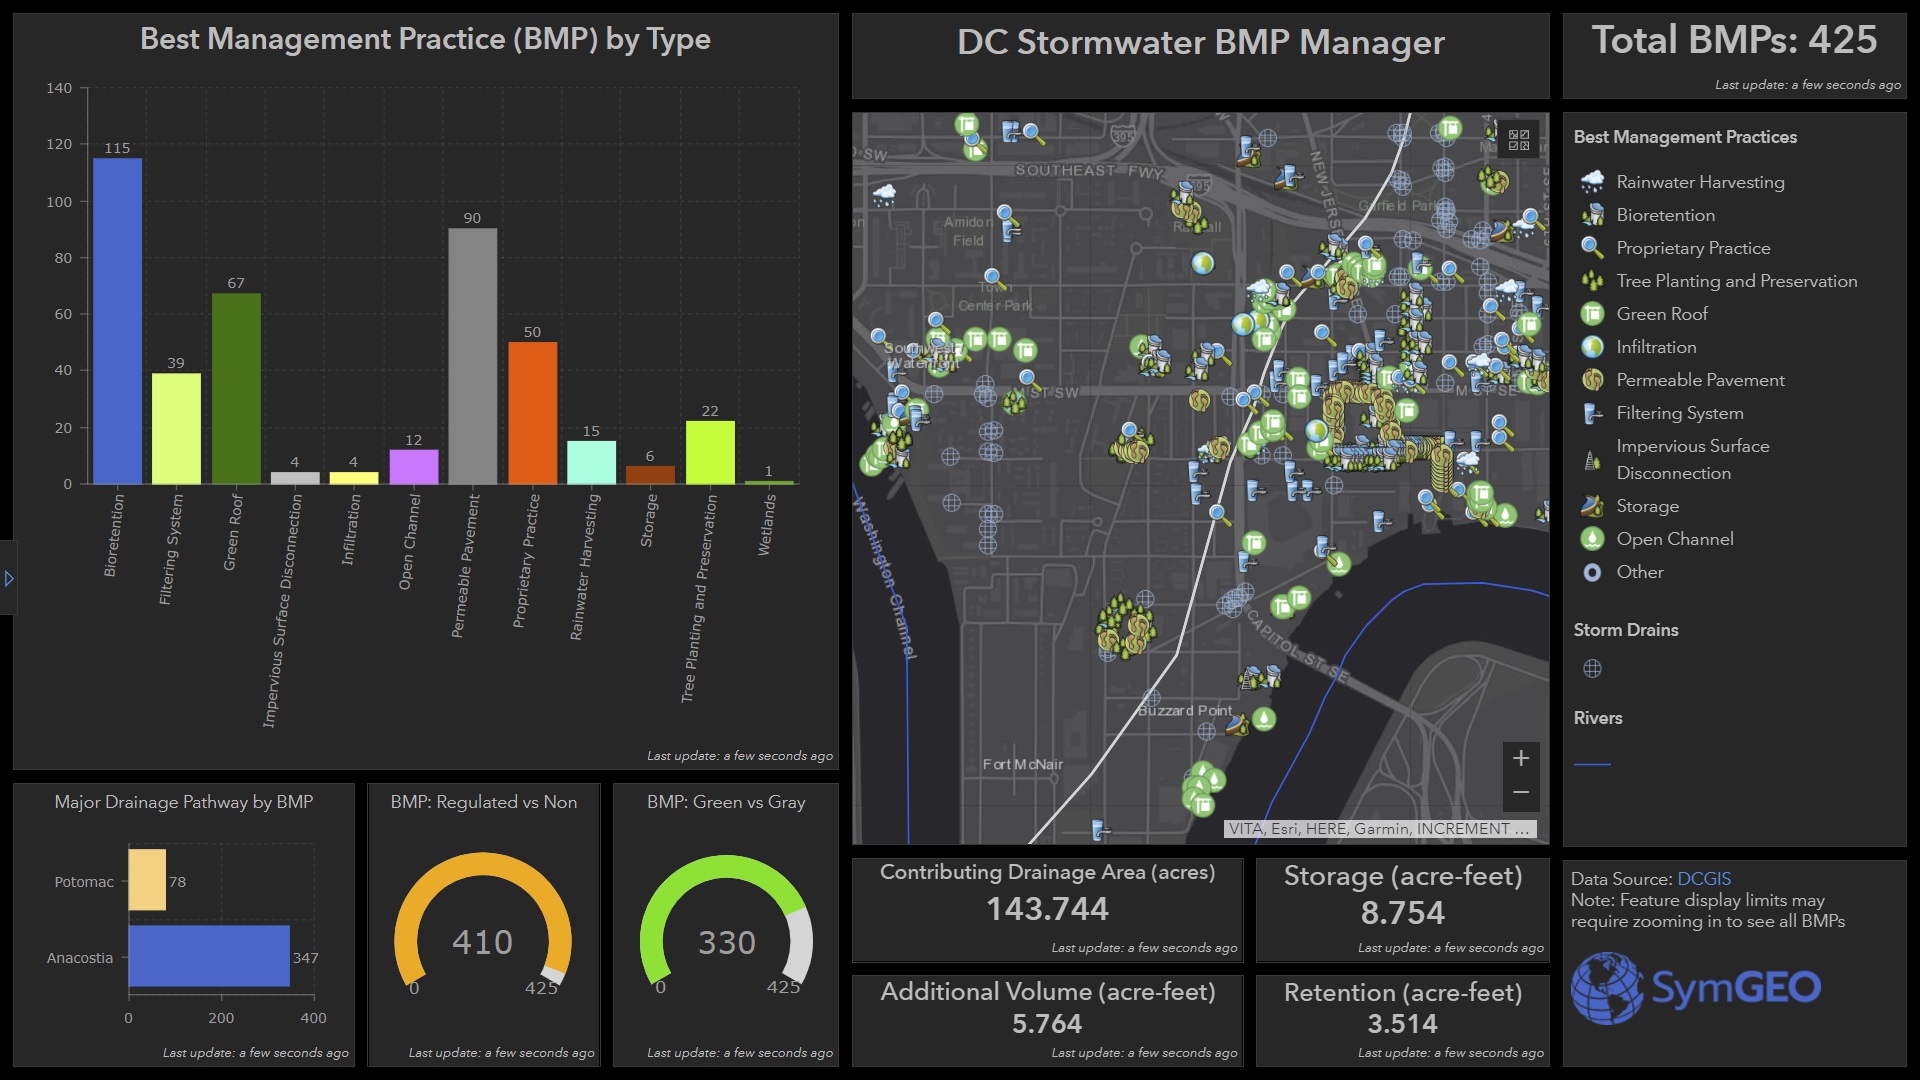
Keeping track of all those stormwater BMP assets is a challenge, so SymGEO has built the DC Stormwater BMP Manager to help. This configurable application uses an ArcGIS Dashboard template, and shows a select set of data attributes to display the characteristics and capabilities of local stormwater BMPs.

The data is coming directly from DC OCTO / DCGIS data servers, shared through Open Data DC. This powers the application with the authoritative data sets, and any updates to the data are immediately reflected in the manager dashboard. All statistics are calculated based on the stormwater BMPs within the view window, allowing interactive explorations around the city.

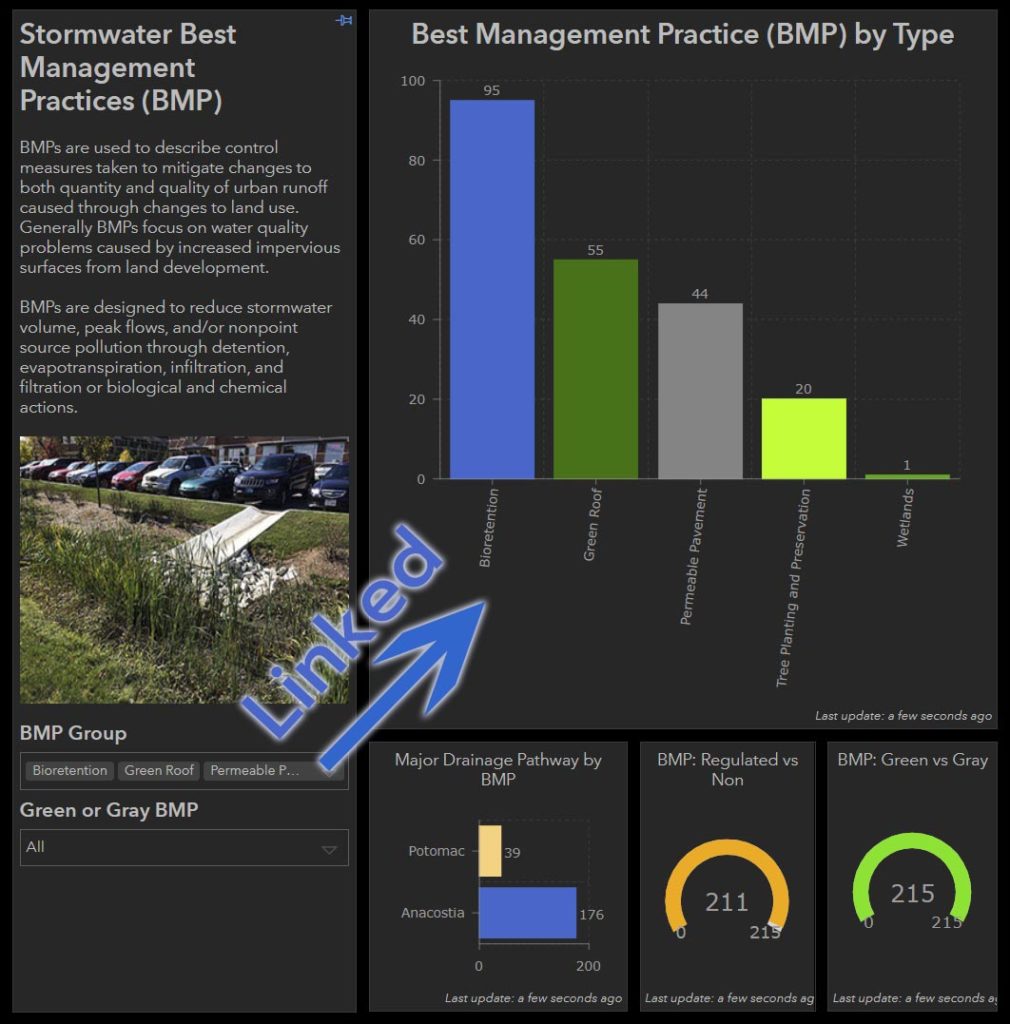
If only a certain subset of data is to be investigated (say by BMP type, or by green vs gray infrastructure), a left-hand panel can be opened to filter the data. All statistics and the map window are linked to those filters, and additional data about each BMP can be accessed by clicking on the BMP feature.

Give the DC Stormwater BMP Manager a spin, and imagine the possibilities using your own data. Contact us for more information on how to effectively display and share your digital assets!