One Main Street Initiative

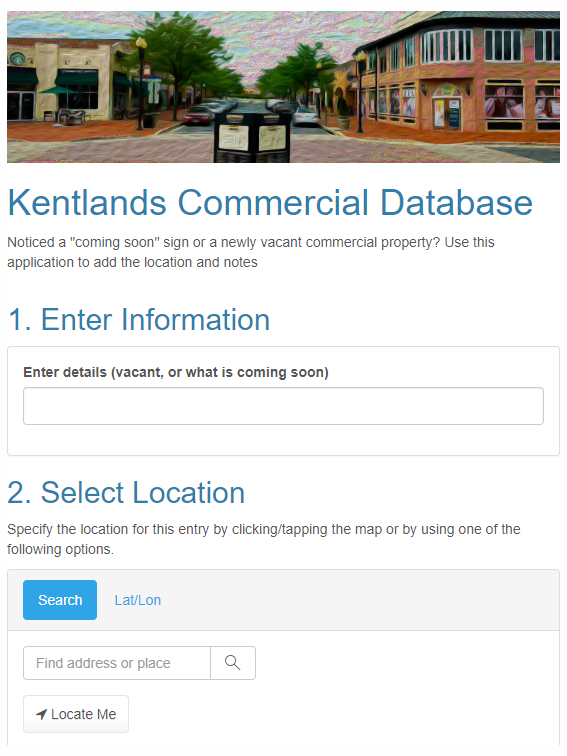
SymGEO is pleased to launch the One Main Street Initiative website produced in collaboration with our local commercial development volunteer committee. This website is powered by ArcGIS Hub technology and is designed to engage business owners and residents in the transformation of the Main Street of Kentlands into a vibrant, family-friendly, retail destination. This was accomplished by summarizing the key findings of a detailed local study conducted by Live Work Learn Play that charted a path forward to energize the Main street through a combination of events, physical improvements, dedicated leadership, and community involvement.

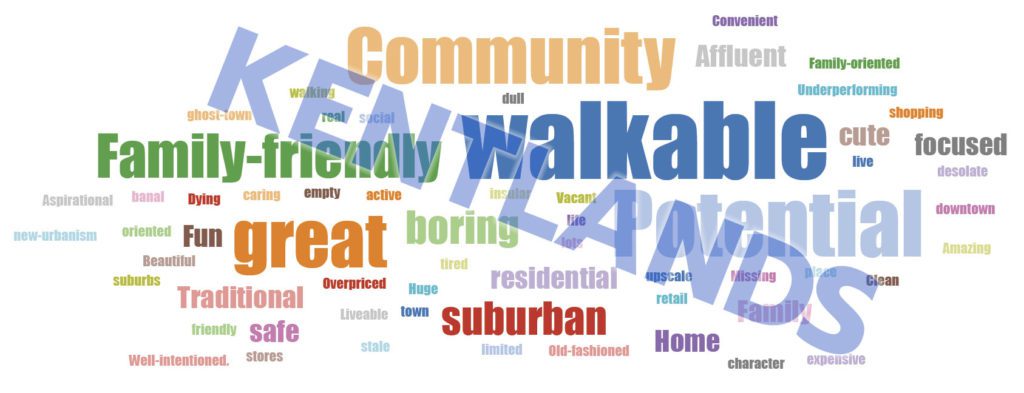
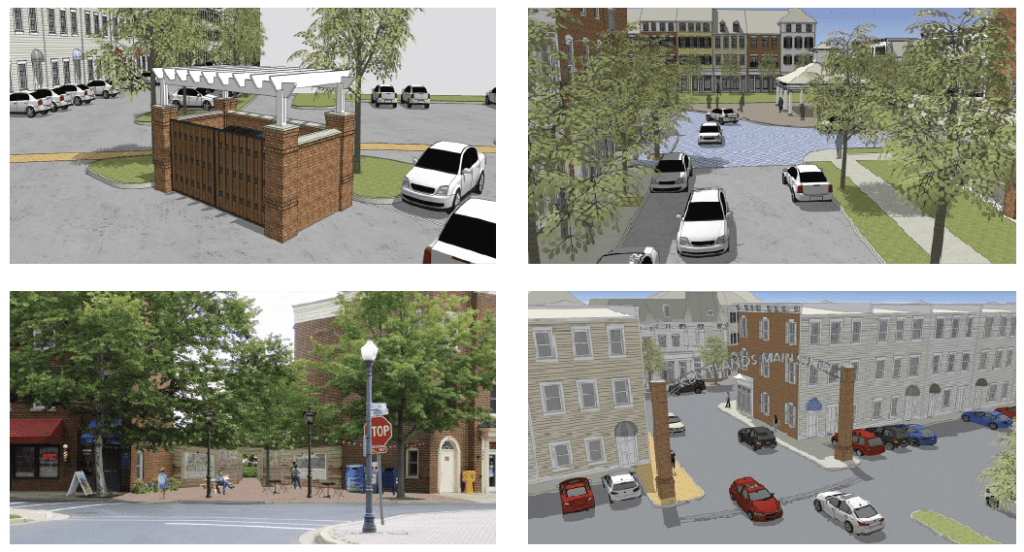
Each key component of the study was summarized and shared using a combination of text and graphics to facilitate community understanding, discussion, and evaluation.

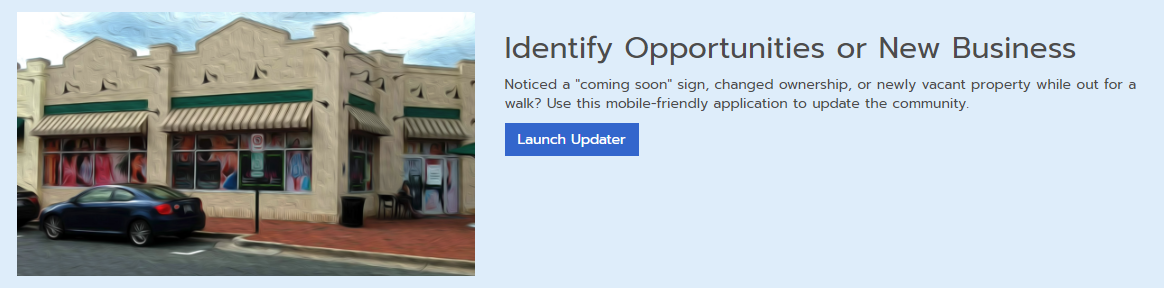
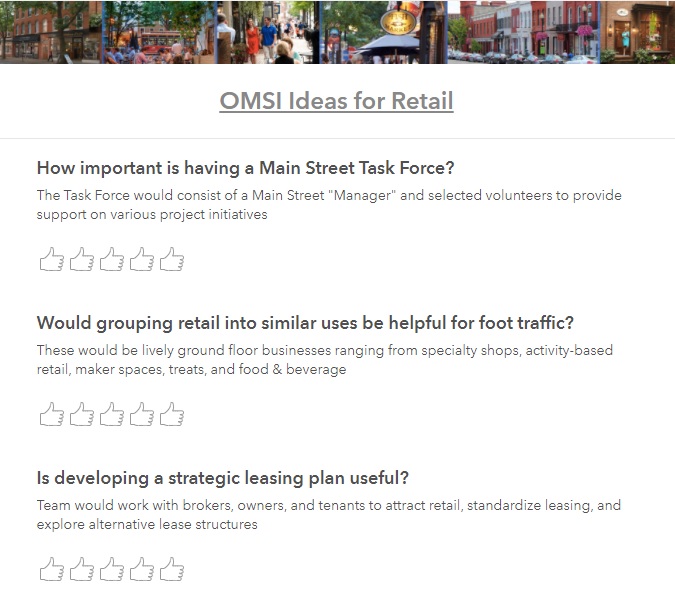
After presenting the key findings, ArcGIS Survey123 was used to gauge public reaction to the importance of each component.

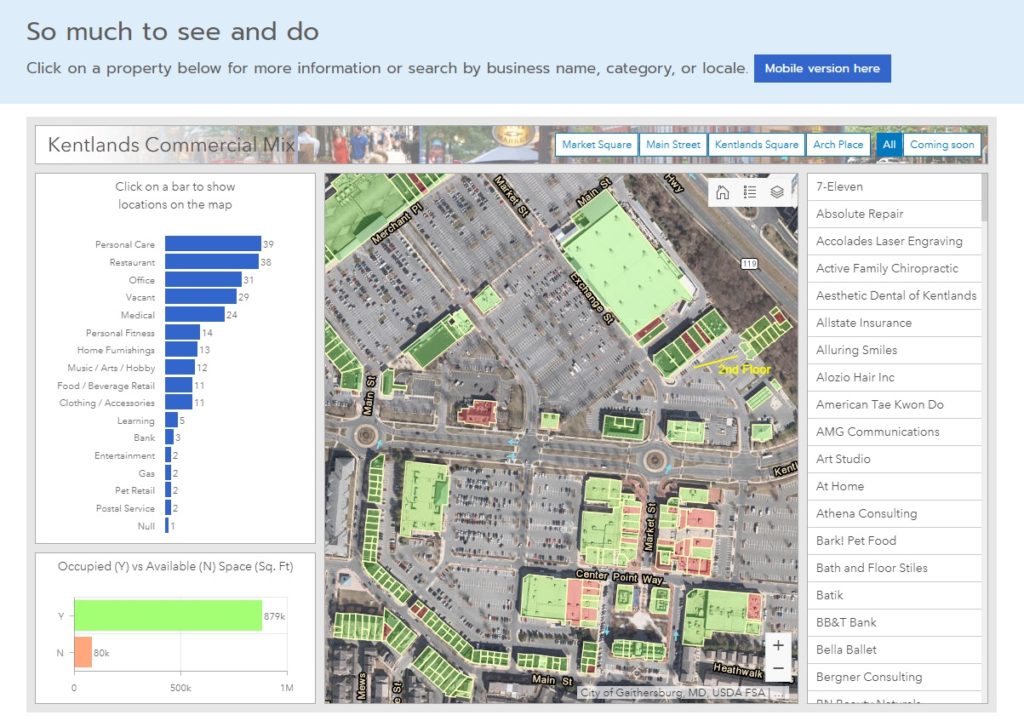
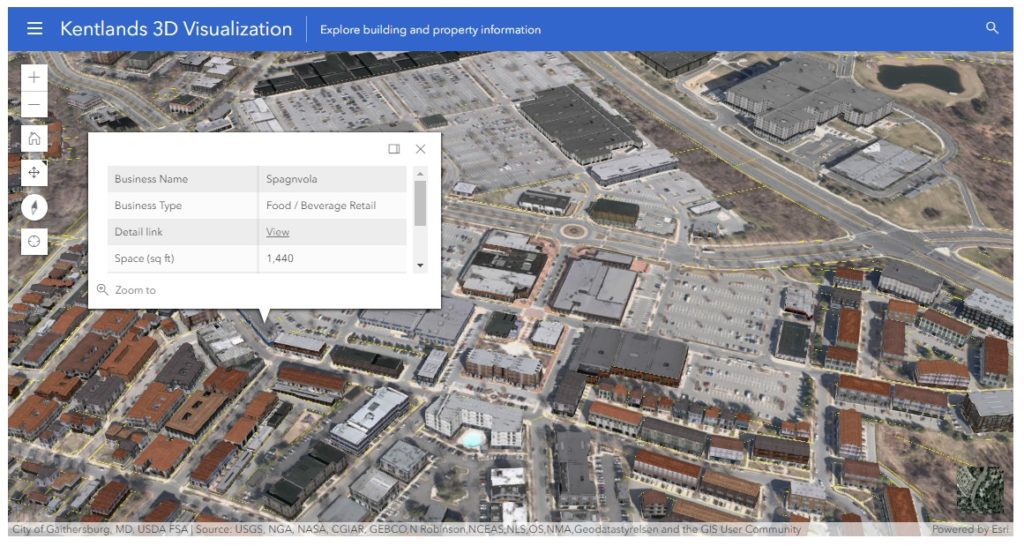
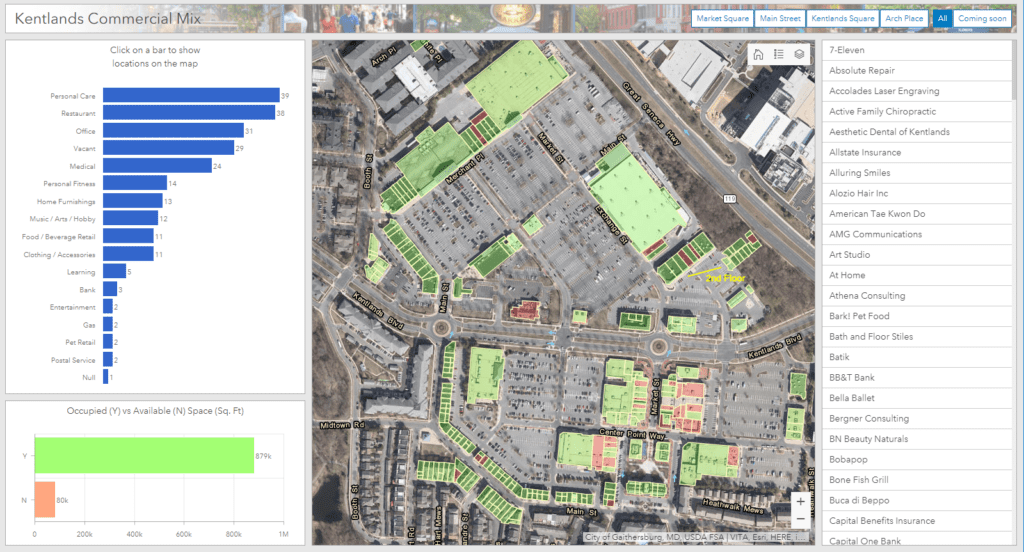
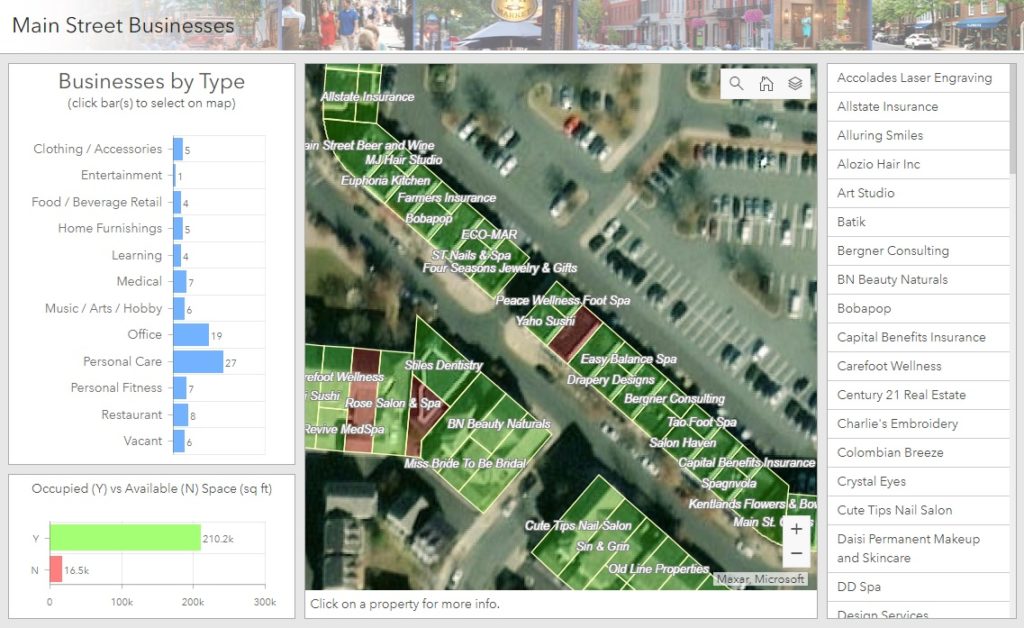
Finally, ArcGIS Dashboards was leveraged to create and share a helpful Main Street Explorer tool (desktop or mobile) for residents to see which businesses are already on Main street and where opportunities for new businesses are located.

Talk to our industry experts today if your community is interested in harnessing the power of Esri’s ArcGIS Hub to share and amplify your development plans – SymGEO is here to help!

Downtown: Energize! in ArcNews

SymGEO was honored to have our community engagement pilot project Downtown: Energize! Kentlands featured in the 2019 ArcNews Spring edition!  This premier hard-copy and digital publication by Esri has a circulation of 900,000 industry professionals and is a go-to source for all that is new and innovative in the Esri GIS community.

This wonderfully in-depth article examines the purpose and need of the site, the benefits brought to residents and businesses, and of course, the amazing Esri technology that makes it all possible.

Check it out, and let us know if your community would like to experience the positive power of Downtown: Energize!

SymGEO Hub in the News

This month we were honored to have Downtown: Energize! featured in two local papers. There has been tremendous energy and enthusiasm swirling around this flagship project from SymGEO, and the technology continues to improve with every update.

lakelands newspaper

Downtown: Energize! features many different components of the ArcGIS technology suite, including Survey123, GeoForm / Collector, ArcGIS Dashboard, Web AppBuilder for the retail locator, and a web scene that uses CityEngine textured models derived from building footprints and Lidar information processed in ArcGIS Pro. These components are then hosted in ArcGIS Online and leveraged using ArcGIS Hub technology.

downtown energize banner

Two local development boards, the Kentlands Downtown Working Group (KDWG) and the One Main Street Initiative (OMSI), took an excited interest in Downtown: Energize! and have commissioned complimentary sites to be built using Hub technology. The commercial real-estate management of the site is especially useful in a fast-paced environment!

kentlands newspaper

“The KDWG was commissioned by the Kentlands board to provide accurate and timely information on the various development efforts going on with our downtown so residents can be better informed and take a more active role in improving our community. We chose the Downtown: Energize! platform developed by SymGEO with its innovative digital mapping because it helps do exactly that.”

– John Ingrassia, Chair, Kentlands Downtown Working Group

“A great commercial district is a huge amenity for our community. Downtown: Energize! is a great digital tool for helping the community achieve the vision for our commercial district. Not only will it help us engage the community to provide flexible two-way dialogue, but it will help us by mapping opportunities where businesses can expand and thrive. This innovative platform will allow us to easily update data, access data and provide data well beyond our community, which provides outreach to businesses looking to expand. Additionally, it is a fun way to empower consumers looking for a place to spend their precious free time to engage with this easy to use tool whether at home or mobile. Working with Kevin at SymGEO has been an amazing experience. He and his team are bringing tremendous innovations and ideas to our team at The One Mainstreet Initiative.”

– Neil Burka, Chair, One Main Street Initiative

“I was so excited when SymGEO came to us with this idea. As a local real estate agent and resident who is deeply engaged in the community, I understand on a personal level how important this spatial data is to get the community engaged and onboard with what’s happening. This platform will make it easy to access the data – especially for folks who, like me, are more visual.”

– Sheena Saydam, Realtor, Keller Williams Capital Properties, Member, Kentlands Downtown Working Group

“Downtown: Energize! as created by Kevin McMaster using the SymGEO platform, is an innovative digital tool that provides mapping of business locations to potential and existing customers in a format that is fun, easy to use, and flexible enough to accept updates and even track current events. It’s a win-win for our community by empowering residents to engage with our local businesses and to energize our downtown!”

– Ingrid L. Fraley, Local Business Owner – Design Services, Inc.

kentlands 3d

If you’d like to join the party with a Downtown: Energize! initiative, let us know as SymGEO is here to help!

Commercial Property Management

Keeping track of who is where, what’s coming soon, square footage available, and when leases are ending can be quite a challenge when hundreds (or thousands!) of properties are involved. Fortunately, GIS is perfectly suited to this task of commercial property management, as it combines space, time, attributes and symbology into one cohesive picture.

For the Kentlands community in Gaithersburg, MD, ArcGIS Online data was used to power an initiative called Downtown: Energize!, that has garnered critical acclaim from residents and business owners alike. This Hub site designed to explore existing retail, gather community ideas, and identify opportunities for commercial business. With almost a hundred commercial properties involved, including several large commercial parcels, the data came in the usual assortment of formats (pdf, GIS, field collection). However, the end result was a cohesive framework designed to be updated and informed by the community it serves through a crowd-sourced GeoForm application.

data updater

geoform

Searching by business name was enabled through a configurable application that is embedded into the Hub site. There is also active development and building reconfiguration occurring in this area, as shown below with the current buildings overlaid on last year’s imagery. This solution provides a one-stop shop for information about current commercial businesses in the area, and a common platform for the community to use.

If your community is ready to get started with a Downtown: Energize! initiative or your business would like to use GIS as a property management tool, let us know as SymGEO is here to help!

Building Imagery and Simulation

There are times when generic building models need to be upgraded to give a better representation of what is actually there. This may be useful for “hero” buildings that are immediately identifiable, or perhaps an area that has planned redevelopment activities taking place. Fortunately, adding custom texture in Esri’s CityEngine is a relatively straight-forward process. In the following example, a building is generated from LiDAR, slightly modified for a complex roof, and then ground photography is mapped as a texture onto the building. Before and after textures are shown below, with the actual building shown in Google Streetview for comparison.

generic building

textured building

google streetview

Another method of adding realism to a presentation is to use the Google Earth platform to capitalize on all of Google’s ground-based LiDAR information and photo mapping (where available). When combined with new building models and a little Photoshop, compelling before-and-after scenarios can be explored in a very cost-effective manner. This example shows where a Kmart complex may be replaced by a high-density residential building.

before-and-after simulation

Viewsheds and site-lines can also be calculated in GIS, as all building models are constructed from either highly accurate geolocated LiDAR information or detailed architectural specifications. This helps pinpoint which existing structures may have their views impacted (shown in green), and so may required additional targeted public outreach before construction begins.

impacted views

Are you planning a new development, want to explore digital 3D data, or need to have your own virtual world built? Let us know, SymGEO is here to help!

Building a Digital City

I was recently asked by a friend in the commercial real estate industry if SymGEO could build a digital representation of Dallas. At the time I was pretty sure we could, based on available data, technology, and 3D modelling experience. However, as we all know in this fast-moving tech-focused industry, being “pretty sure” is a dangerous position, so today was the day to find out.

Our journey started with finding building footprints, which the City of Dallas has made available for download based on 2009 aerial photography. Fortunately, wide-area LiDAR with approximately 1 meter spacing was also collected at the same time and made available through TNRIS. This high-density survey method gave a blanket of point elevations, which are then used to derive digital terrain models (ground), and digital surface models (buildings and trees). When combined with building footprints, these are the best ingredients for a 3D city model.

The next step was to run a series of scripts and tasks within ArcGIS Pro to determine the average height of each building and whether the roofs were sloped or flat. This gave great preliminary results, but due to the complex roofs in the downtown area, some generalization errors were introduced into the model, as each footprint could only have a single height associated with it. These errors can be quickly spotted by buildings that either have LiDAR points above the building envelope (circled in black), or a building envelope above the LiDAR points (circled in white).

Fortunately, due to the relative ease of spotting errors, the building footprints could be quickly modified to break them up based on the roof components to give multiple heights per footprint.

Interestingly enough, several footprint displacement errors were also discovered in the city-provided data during this process, so those were fixed at the same time. After several hours of fixing and segmenting footprints, the scripts were run again to re-calculate the buildings. Needless to say, it was easy and gratifying to see the rapid improvements in the model.

Finally, we brought the model into Esri’s CityEngine to give it a little color. When the digital dust settled, a fine looking model of Dallas emerged. See below, with a similar view of downtown Dallas from Google shown for comparative purposes.

Are you interested in having a digital city built, or would like to find out what else can be done with 3D modeling?

Let us know, as we’re here to help, and “Yes, we can build a digital city.”

3D Building Visualization

SymGEO is excited to share a peek behind the scenes into our cutting edge 3D building visualization products leveraging Esri CityEngine and a little post-processing magic. The end result is a virtual environment that can’t wait to be explored! Each building is generated from building mass information or building footprints. Textures are added based on zoning information and can be fully customized if building photography is available.

Once the existing environment is built out, the fun begins of playing “what-if” scenarios for proposed commercial or residential developments.

Full control over camera and environmental variables allows the presentation of 3D building data in the optimum light.

Video fly-over gives the ultimate in bird’s eye perspective and allows stakeholders full visibility into a proposed development.

Needless to say, this powerful combination of software makes compelling, cost-effective 3D building presentations a reality.

Check out our fun, promotional video on YouTube and let us know if your world is ready for this!