Did you know that when heavy rain falls in an urban environment, most of it will run off the roads and buildings into concrete channels and quickly dump into streams and rivers? This “stormwater” can be very damaging, as all the water enters into the streams at virtually the same time, so channel erosion and water quality are serious concerns. In natural environments, the water is slowed down and filtered by things like trees, wetlands, soaking into the ground and moving through the landscape.
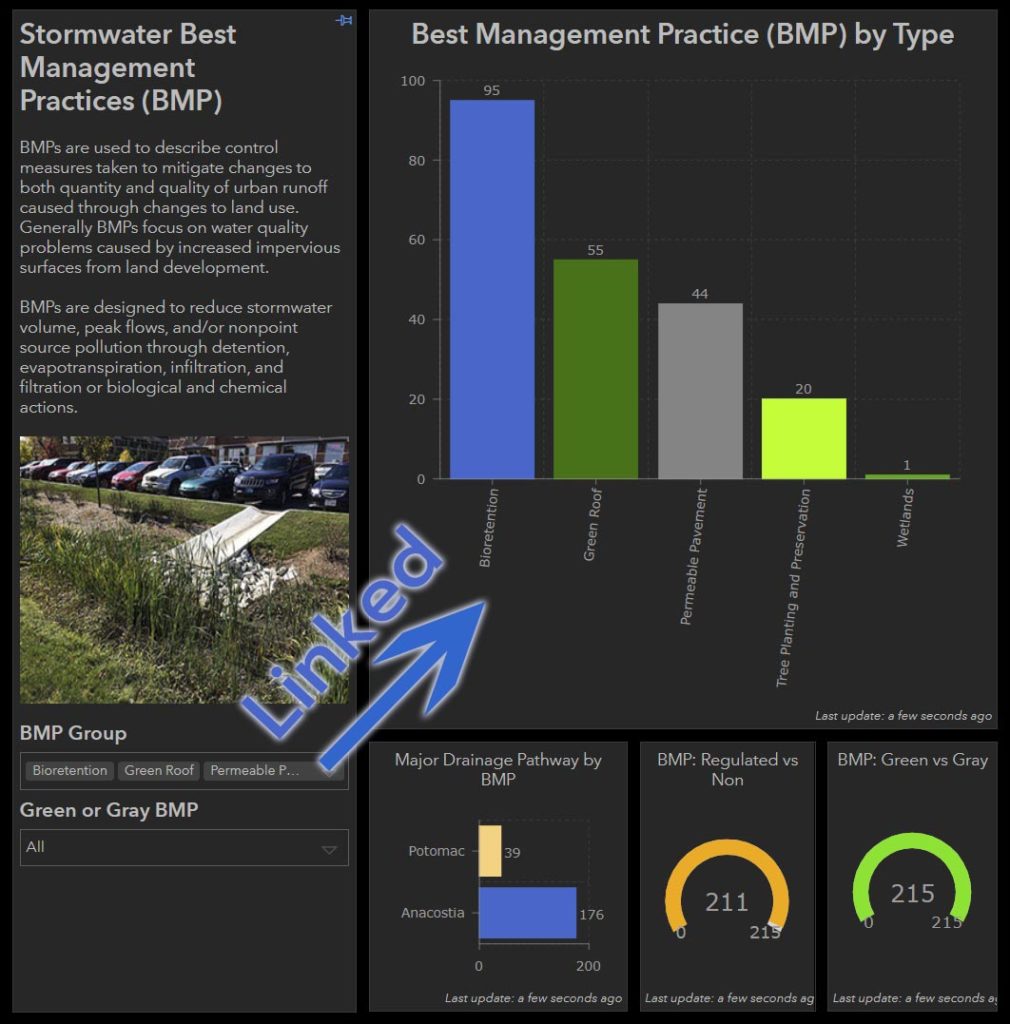
To help mimic the function of the natural environment, urban planners and municipal engineers construct stormwater “Best Management Practices” (or BMPs) to help filter and slow down the water on its way to the nearest stream. Stormwater BMPs may include structures such as reservoirs, green roofs, permeable pavement, filtering ponds, or rainwater harvesting among others.
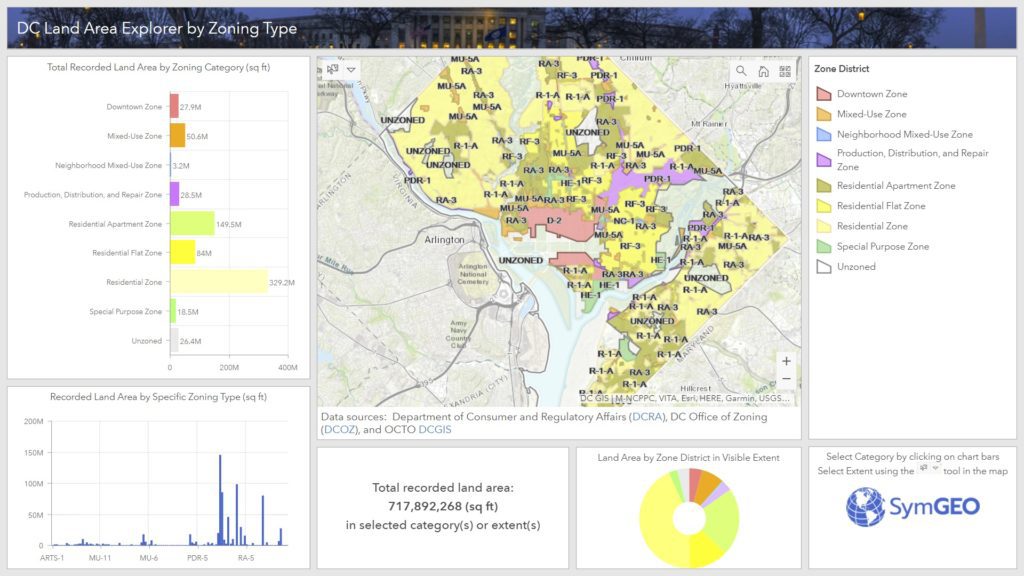
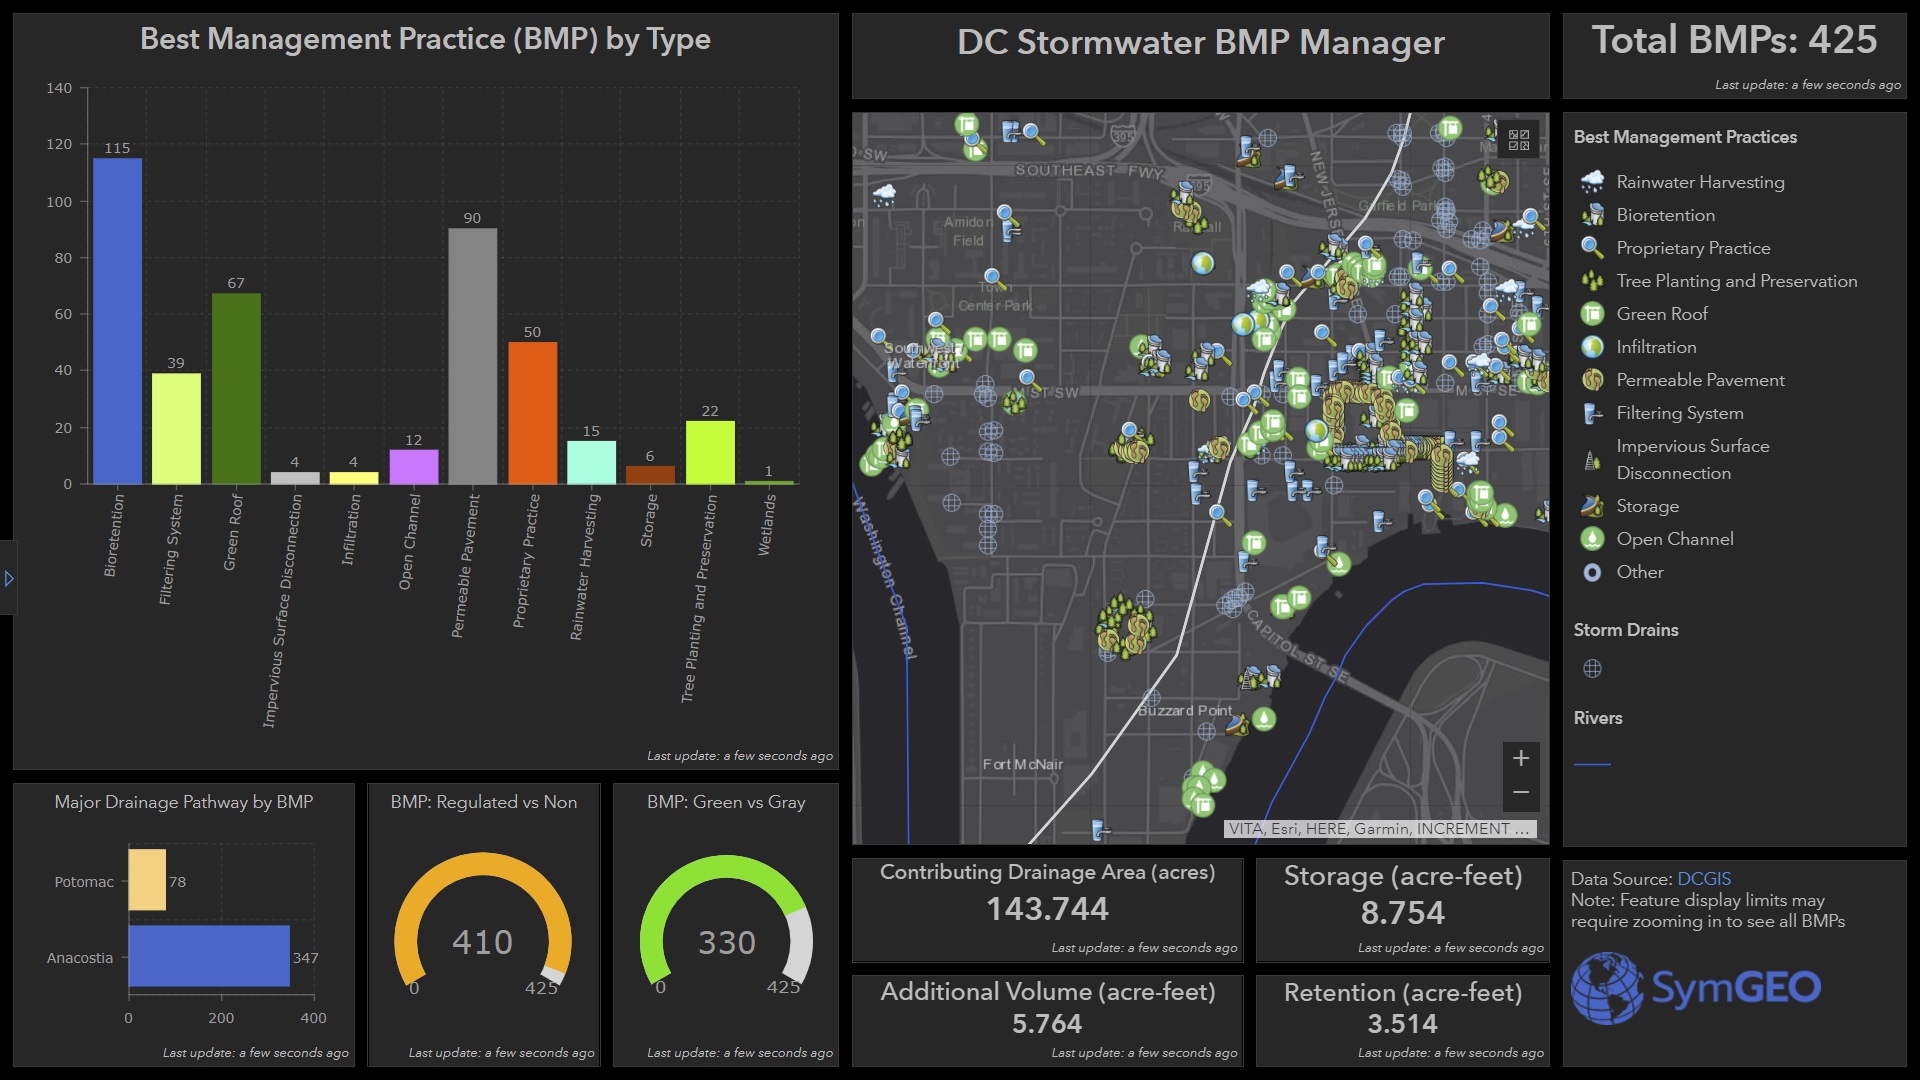
Keeping track of all those stormwater BMP assets is a challenge, so SymGEO has built the DC Stormwater BMP Manager to help. This configurable application uses an ArcGIS Dashboard template, and shows a select set of data attributes to display the characteristics and capabilities of local stormwater BMPs.

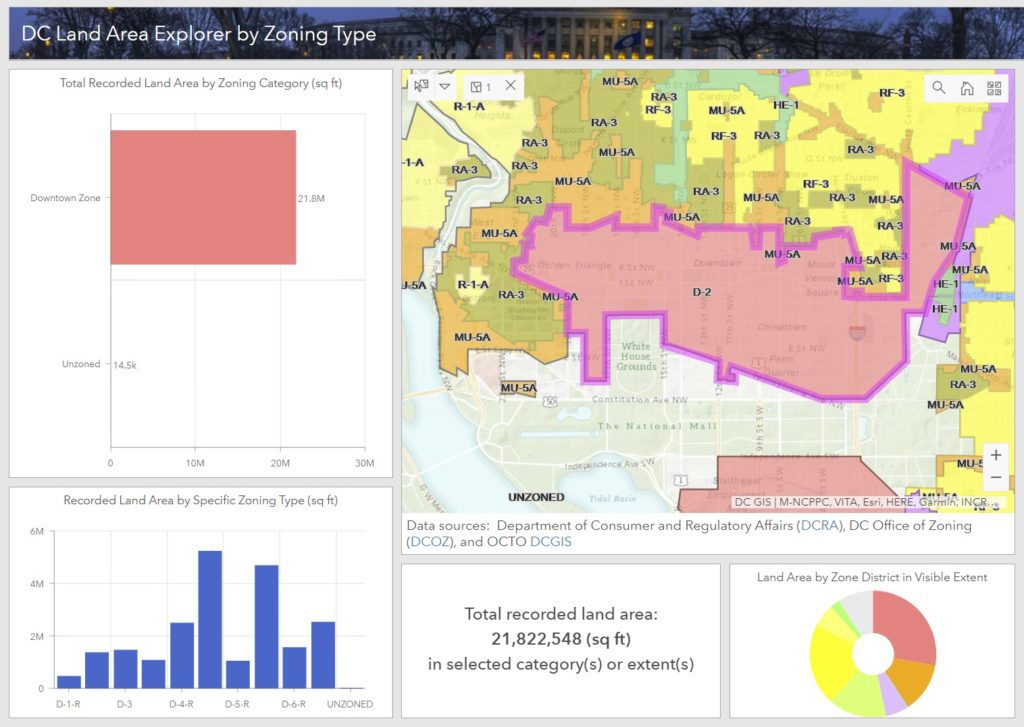
The data is coming directly from DC OCTO / DCGIS data servers, shared through Open Data DC. This powers the application with the authoritative data sets, and any updates to the data are immediately reflected in the manager dashboard. All statistics are calculated based on the stormwater BMPs within the view window, allowing interactive explorations around the city.
If only a certain subset of data is to be investigated (say by BMP type, or by green vs gray infrastructure), a left-hand panel can be opened to filter the data. All statistics and the map window are linked to those filters, and additional data about each BMP can be accessed by clicking on the BMP feature.
Give the DC Stormwater BMP Manager a spin, and imagine the possibilities using your own data. Contact us for more information on how to effectively display and share your digital assets!