Special Event Operations at DDOT

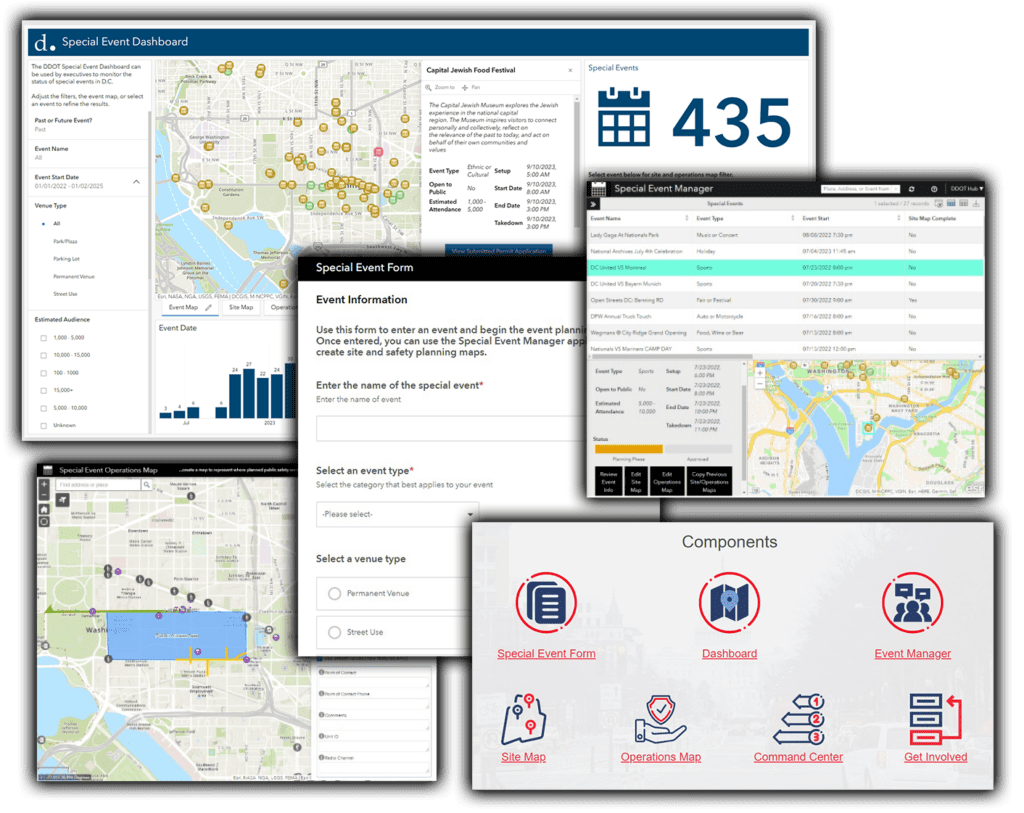
Esri’s Special Event Operations is a configurable solution that helps organize special events, create event site maps, develop health and safety plans, manage event incidents and assignments, monitor public health and safety operations, and create after-action reports. The District Department of Transportation (DDOT) recognized the value of having comprehensive information about an event in one authoritative, collaborative place, and asked SymGEO to help configure and deploy Special Event Operations for their internal use.
“The Special Events solution has sparked a new level of excitement in preparing for special events in the city. With SymGEO’s technical help, DDOT now has improved internal communication and decision-making abilities. The training provided by SymGEO has been super beneficial – they are a treasure!”

– DDOT Program Manager, Traffic Management Center

ArcGIS Hub was used to host the solution as it facilitated the understanding and workflow of how each individual component fits into the comprehensive picture.
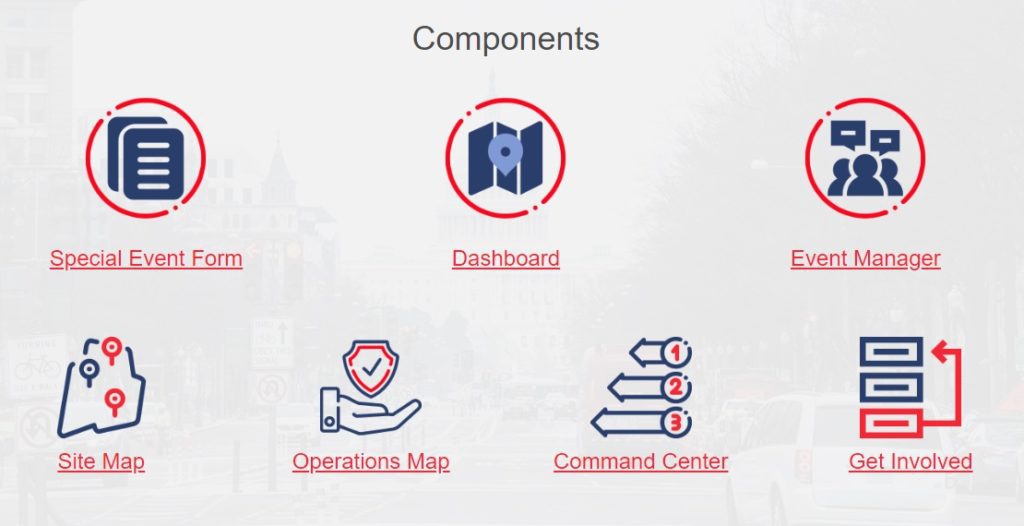
The solution is built around a core data set of special events. Individual events are initially “registered” with the solution using an ArcGIS Survey123 intake form.

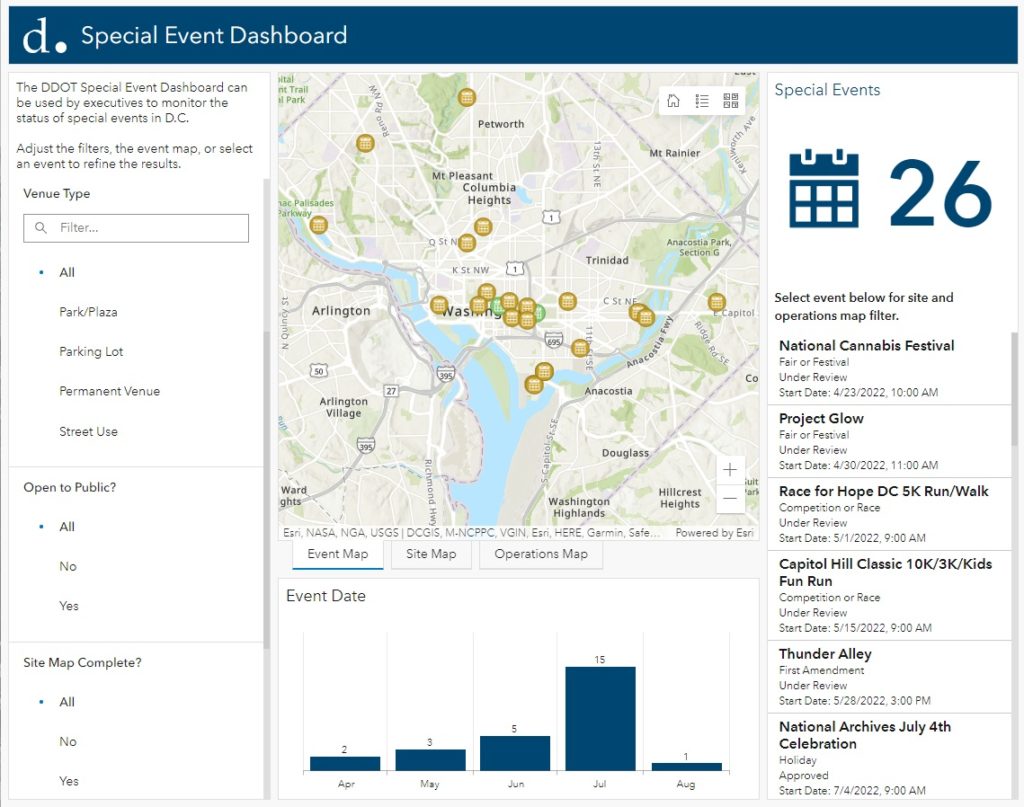
An ArcGIS Dashboard uses the event information to give managers an overview of upcoming (or past) events that can be filtered by venue type, expected crowd size, approval status, or other event characteristics.
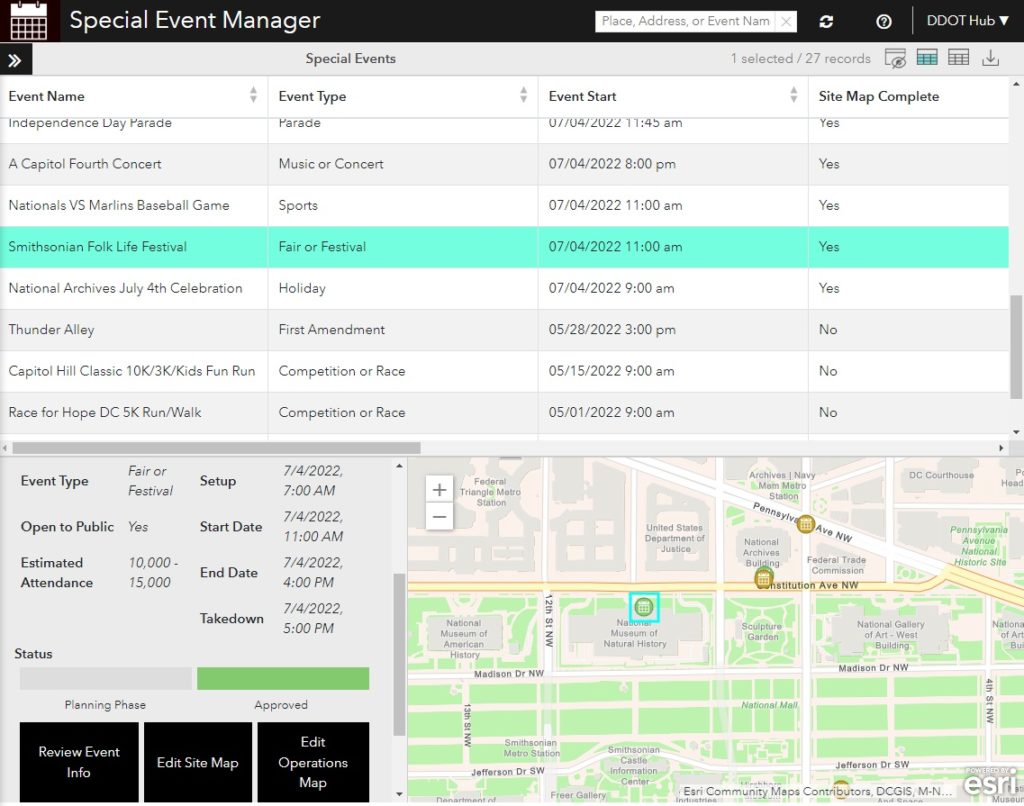
The Special Event Manager is used to dive deep into specific events. From this interface, site maps or operation maps can be created, copied from past events, reviewed, and eventually approved.
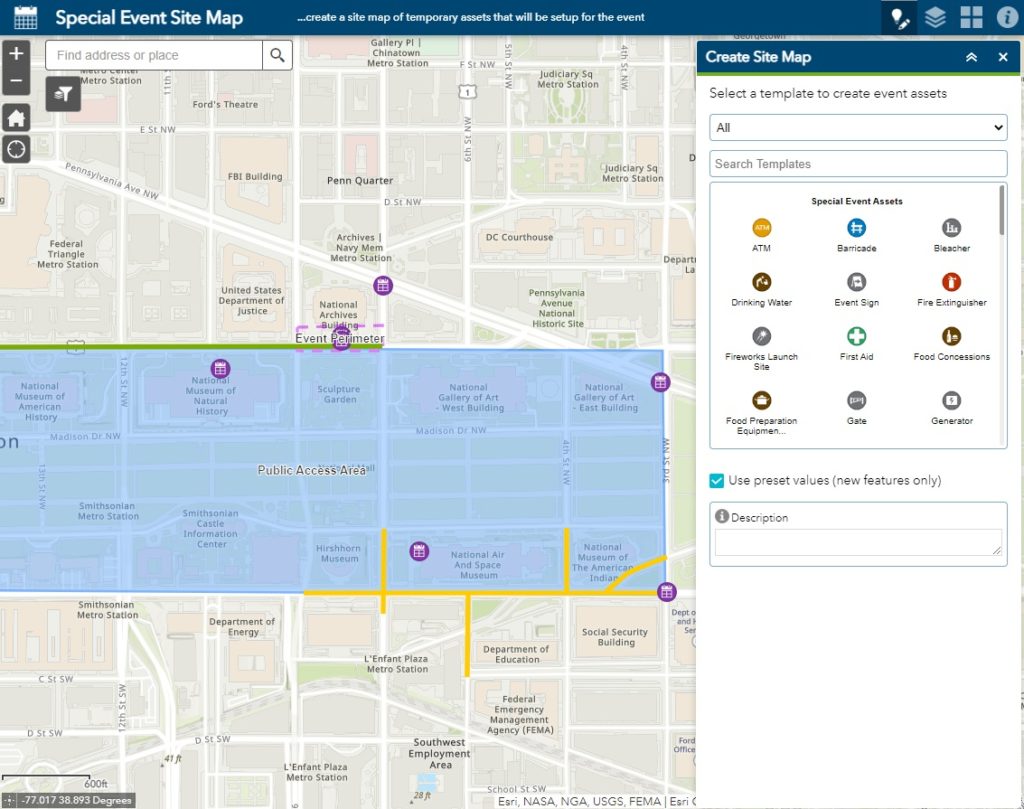
The Special Event Site Map interface facilitates the creation of site maps linked to individual events. Site maps include the point, line, or area representation of event physical features. This may include signs, fire lanes, event perimeters, or other stationary event components.
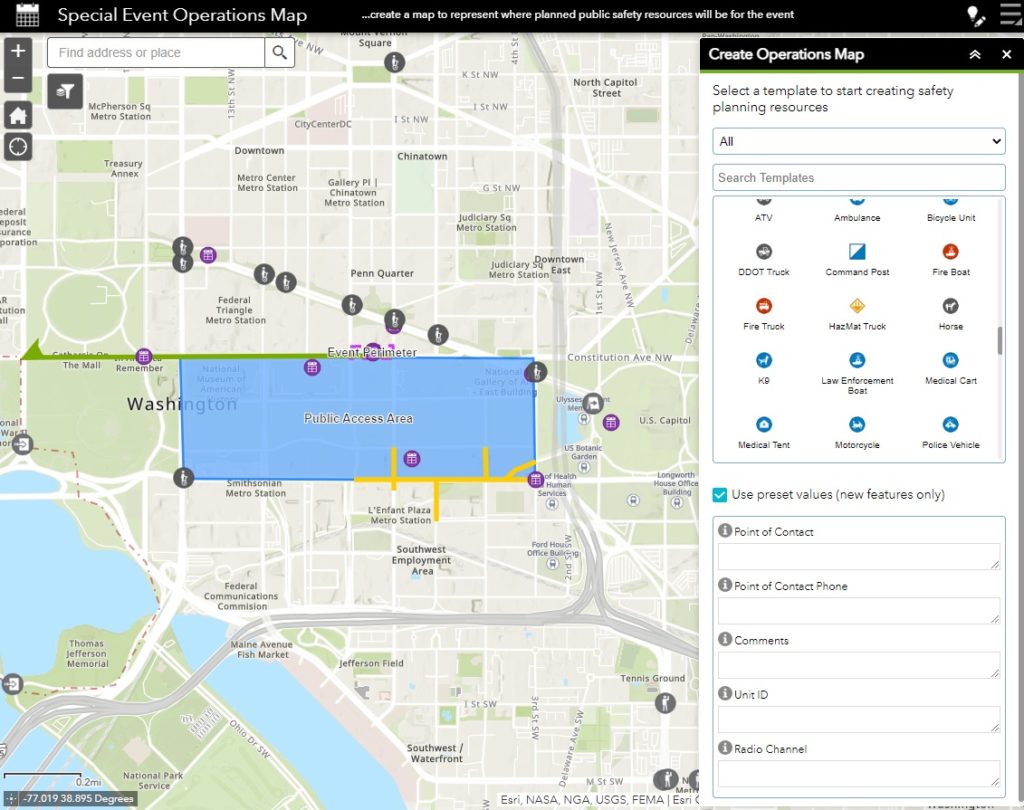
The operations map includes mobile or distributed resources that will be actively deployed during the event. This may include trucks, traffic control officers, resource assignment paths, staging areas, or security perimeters.
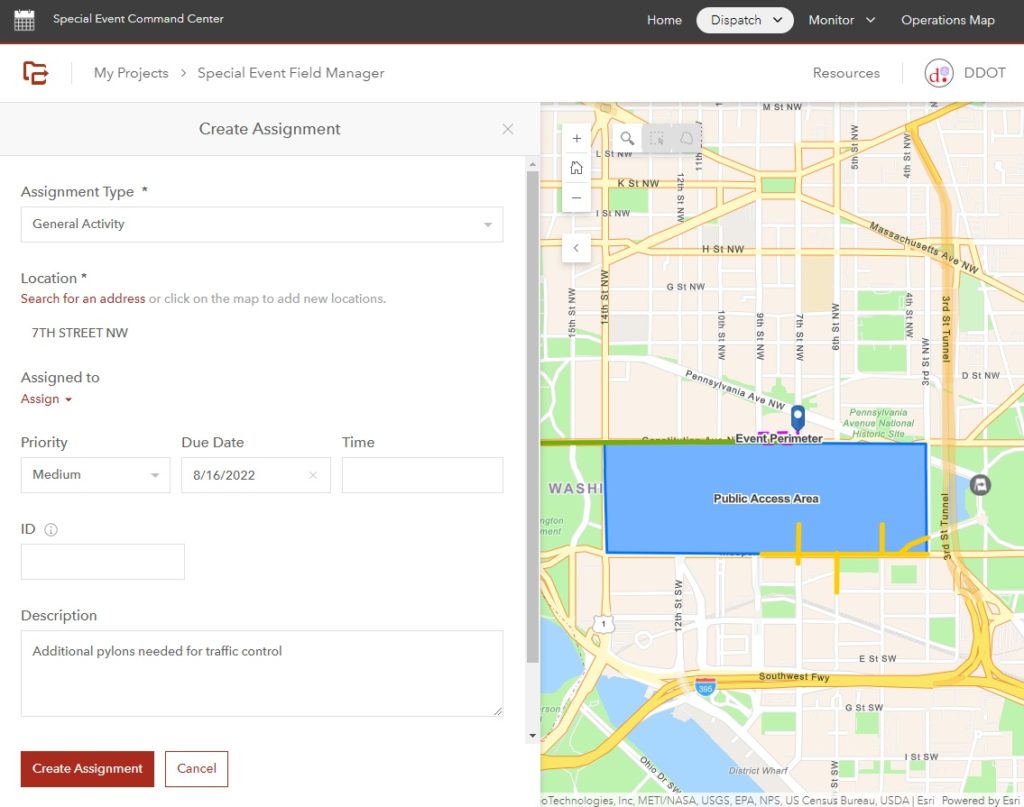
During an event, assignments can be created and assigned from the Special Event Command Center. Assignment deployment, tracking, and in-the-field responses are managed using ArcGIS Workforce behind the scenes.
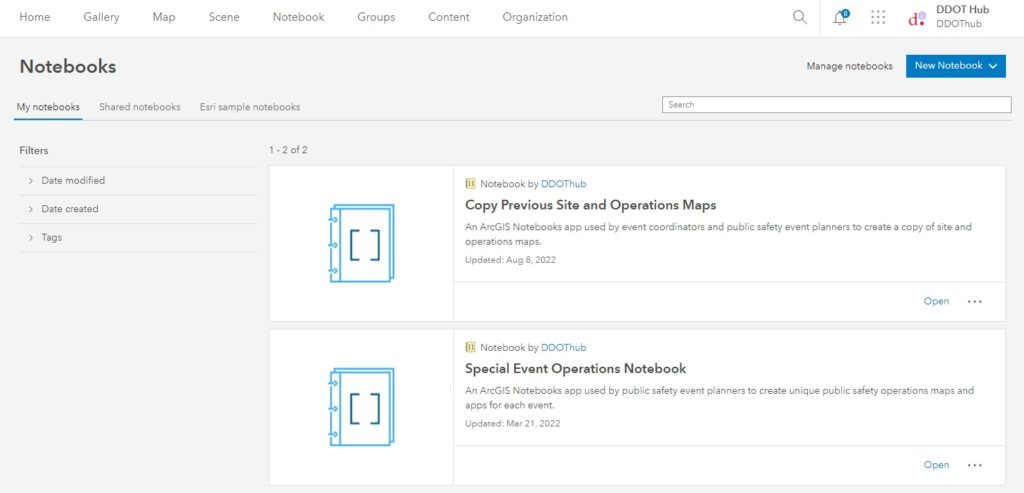
ArcGIS Notebooks are used to copy site plans and operations maps from previous events. This saves time, money, and the duplication of effort for annual or repeating events.
Talk to SymGEO today if your agency or organization is interested in managing special events using the power of Esri’s Special Event Operations solution – we are certified experts and here to help.
Capital Projects Dashboard

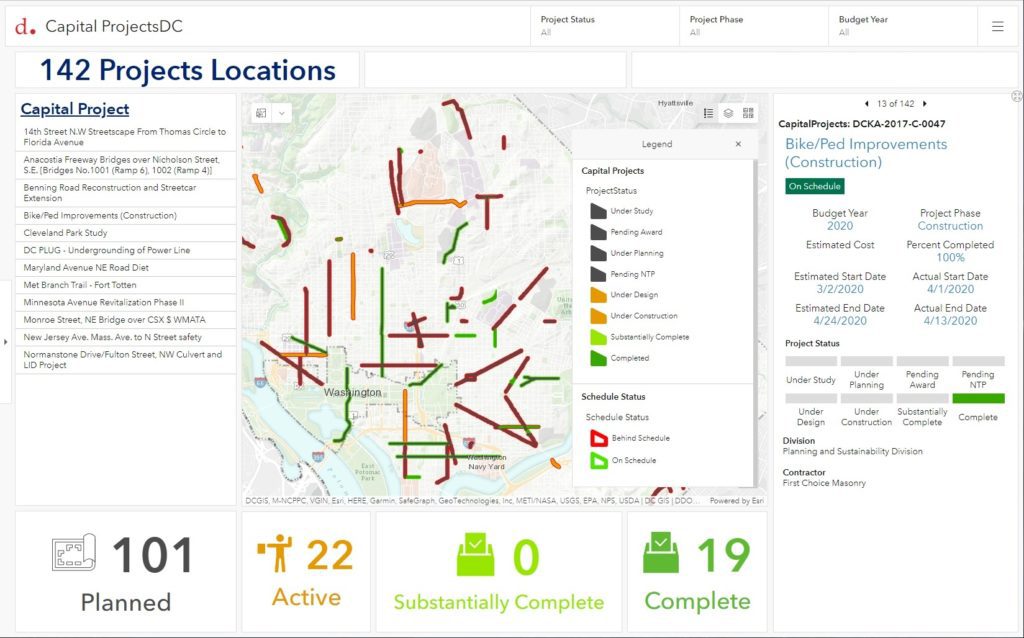
The District Department of Transportation (DDOT) manages millions of dollars’ worth of capital projects on an annual basis. To facilitate the communication of budget and schedule status, SymGEO helped configure a Capital Projects Dashboard solution for internal use, powered by ArcGIS Dashboards technology.

“This is so good! I love it and it is a game-changer. I am really impressed and could not be more thankful for this. This is a great tool for the agency to get things straight in the system and then use it as a tool for tracking.”

– DDOT Chief Performance Officer

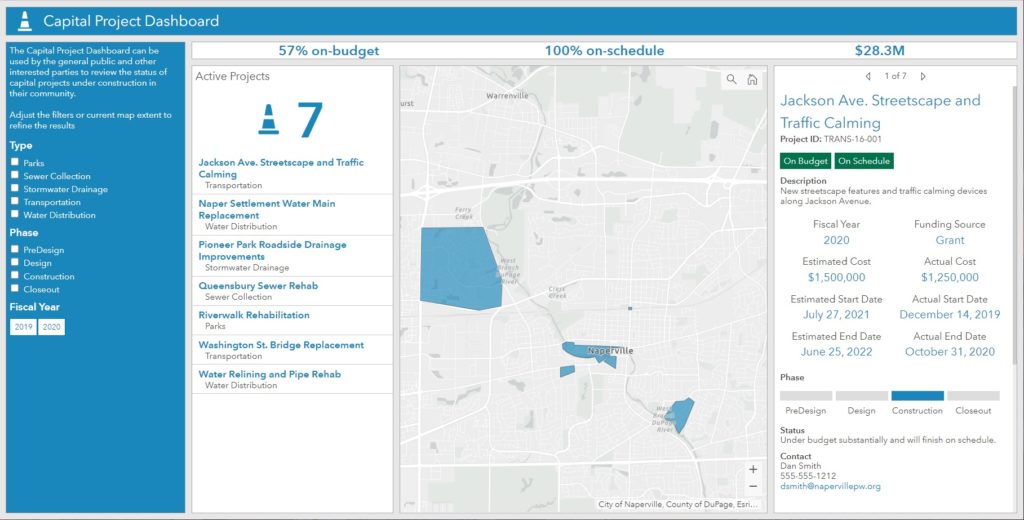
The configured solution builds on an Esri-provided template (below) and provides insight by budget year, construction status, and project phase. Summary statistics are provided as numerical indicators, and map symbology is used to visually communicate project status. The Arcade expressions, used to determine project status, were configured to fit DDOT’s capital project data schema using data provided by DDOT’s internal project management system.

capital projects dashboard template

Talk to SymGEO today if your agency or organization is interested in managing capital projects using the power of Esri’s Capital Project Dashboard solution – we are certified experts and here to help.
Local Government Solution: Citizen Problem Reporter

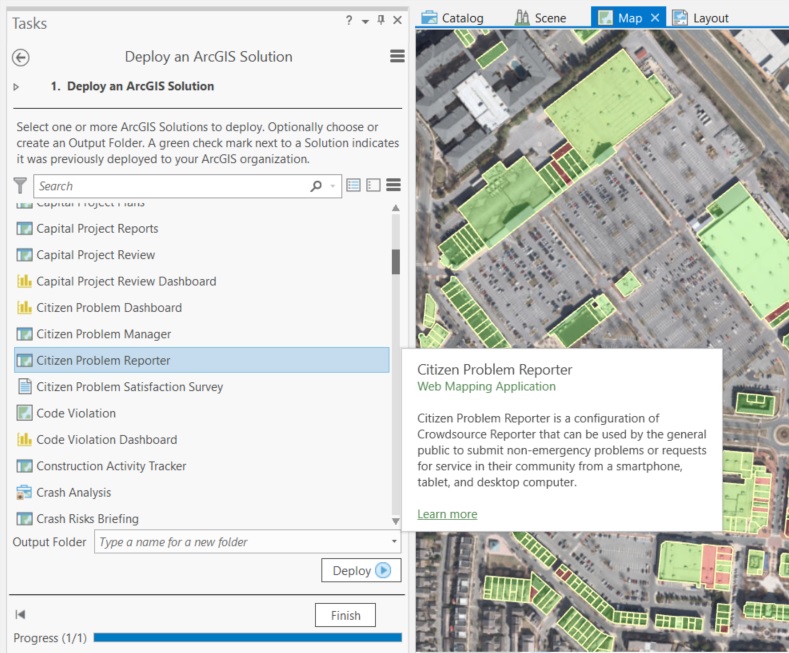
How great would it be to have a solution already developed for you and only some configuration is needed to roll it out? Today we look at the “Citizen Problem Reporter” solution developed by Esri to address a reoccurring need in local government.

Every local government has access to real-time, mobile sensors that travel throughout their jurisdiction on a daily basis. You guessed it, their citizens are their sensors! People notice issues left, right, and center. When armed with the right tools, people can be the eyes and ears of the community, giving near-instant notification of any concerns. These may range from dangers such as downed power-lines, or trash that wasn’t collected, or graffiti, or… the list goes on!

To help get the solution jump-started, Esri has developed a set of data and applications that fit together into a government’s ArcGIS online account.

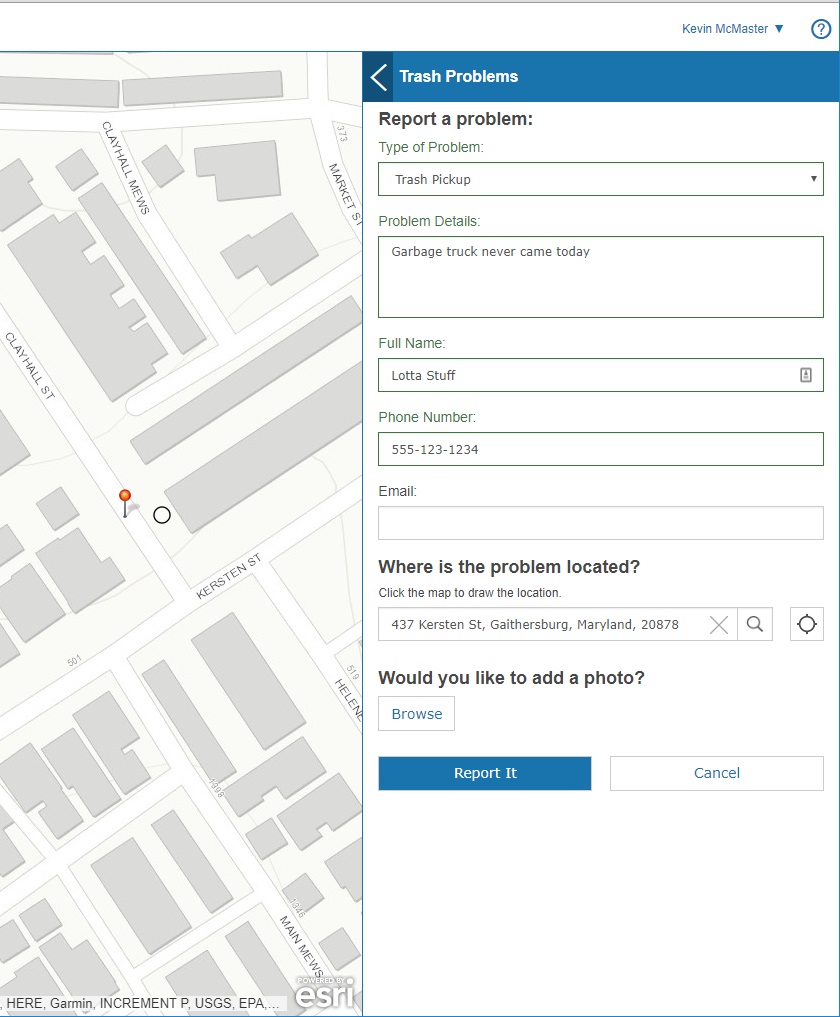
The solution includes an application that a citizen uses to report a problem through a fully mobile-responsive web interface. Great for easy access on the go!

citizen reporter application

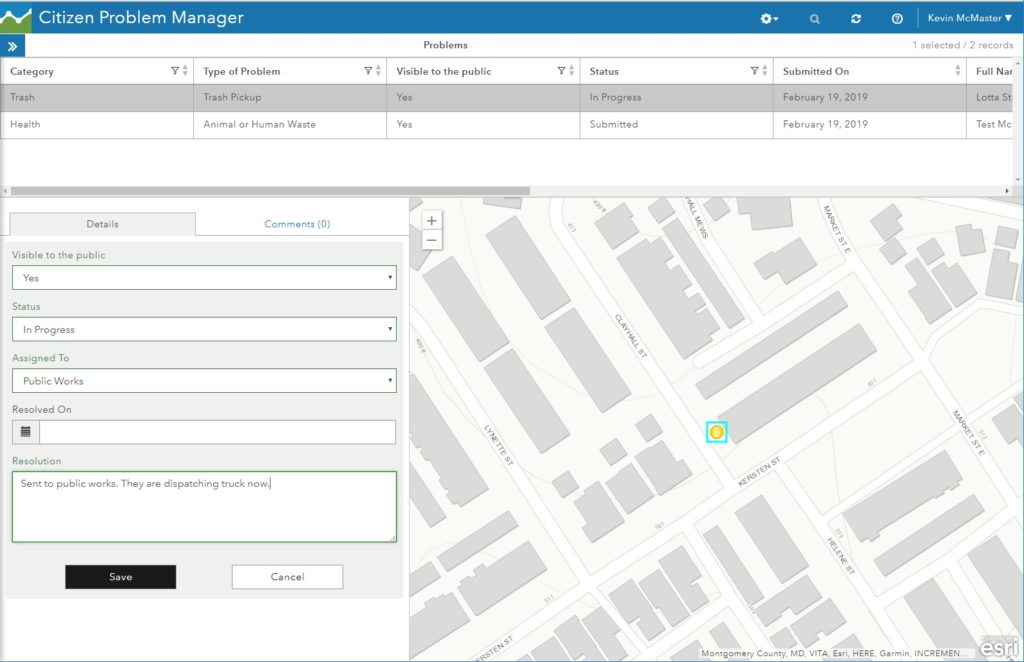
Once reported, the citizen problem manager sees all the issues using a separate application. They will route the issue to the appropriate department, add notes, and update the resolution status.

citizen problem manager

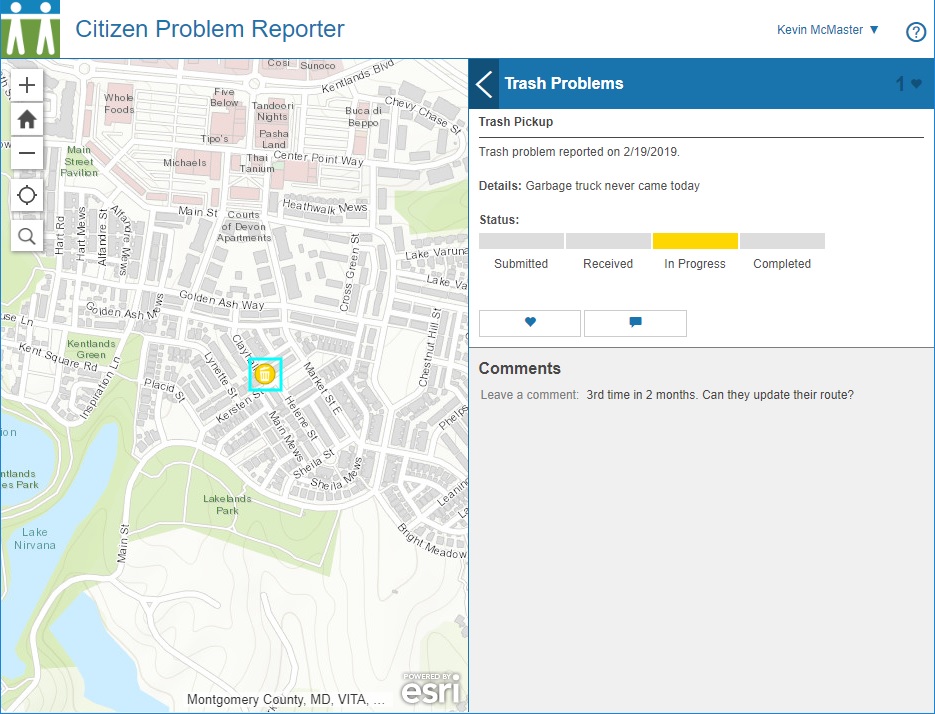
Citizens see the status of all issues through their application and know that they are being addressed. People can add notes, “up-vote” an issue, and make it into a social media platform if desired.

citizen problem reporter social

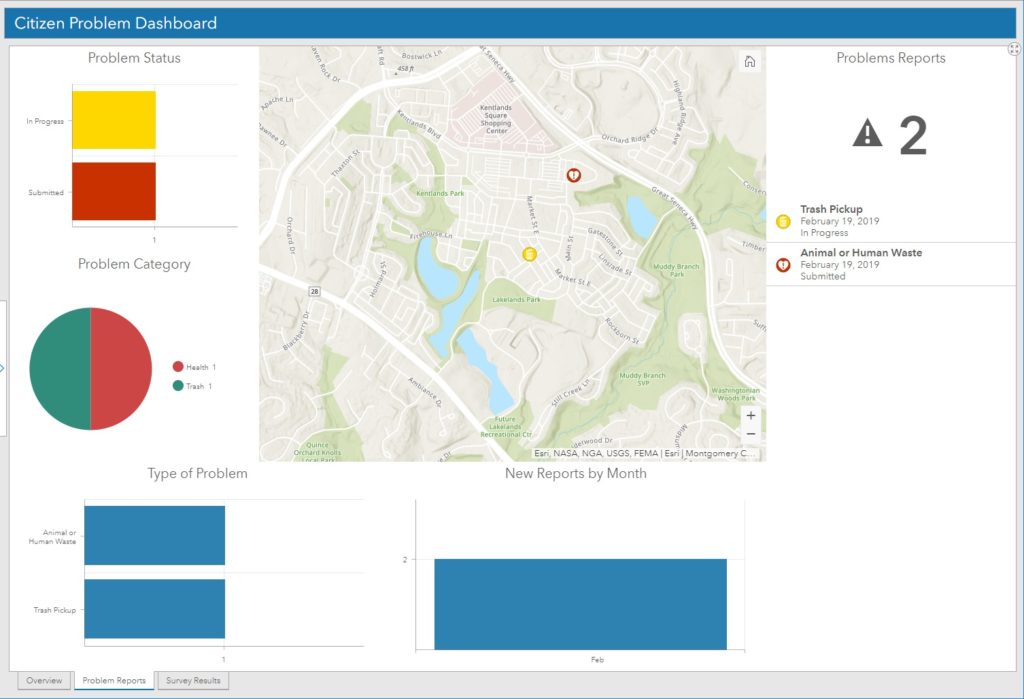
On the manager side, a dashboard keeps track of all issues that have been recently submitted. This helps to spot trends and identify departments that may need extra resources to address the needs.

issue dashboard

A statistical component of the dashboard keeps track of the requests over time and displays the status of all requests.

issue dashboard status

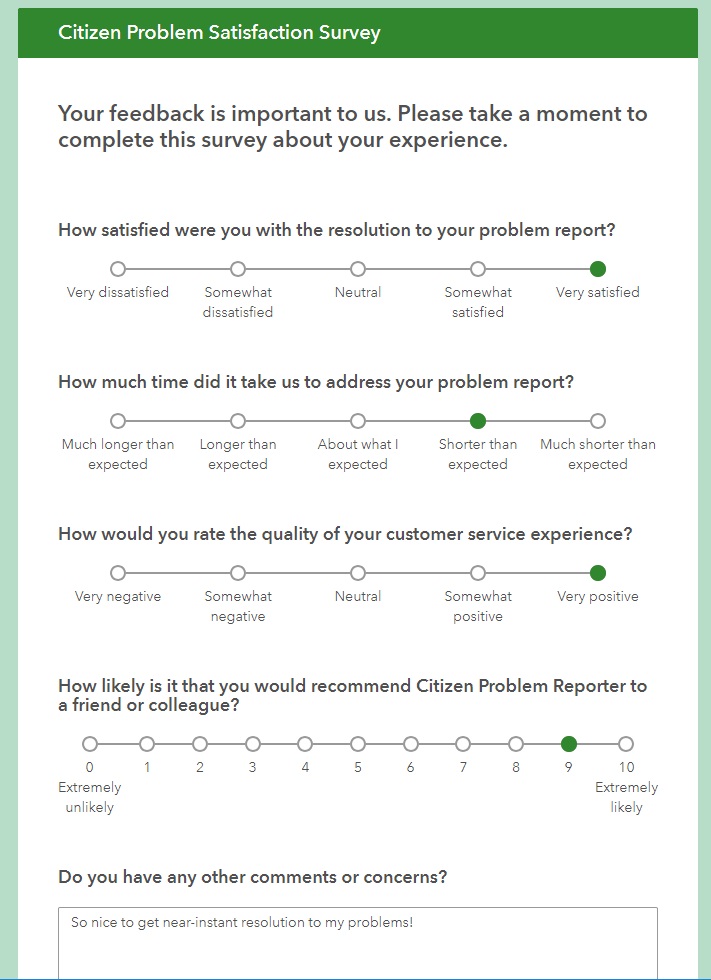
Optionally, a survey can be sent to the citizen who reported the issue to help close the loop and keep them engaged with the process.

reporter survey

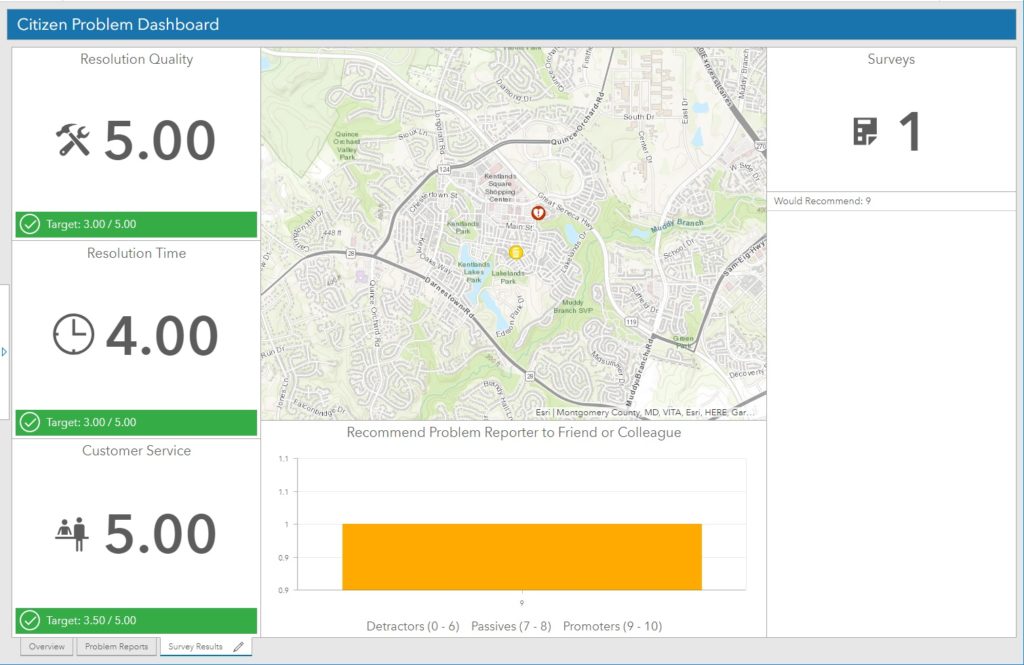
Finally, the manager dashboard also keeps track of survey responses. This is helpful to view perceived responsiveness of the department and show where improvement may be needed.

reporter survey dashboard

This local government solution is just one of many that have been pre-assembled and tested by Esri professional staff.

If you’d like help deploying this or other Esri Local Government Solutions, let SymGEO know, as we’re here to help!